$$P(response)=1-[1+dose\frac{2^{\frac{1}{a}}-1}{N^{50}} ]^{-a}$$
Description
|
|
||||||||||||||||||||||
|
||||||||||||||||||||||||||||||
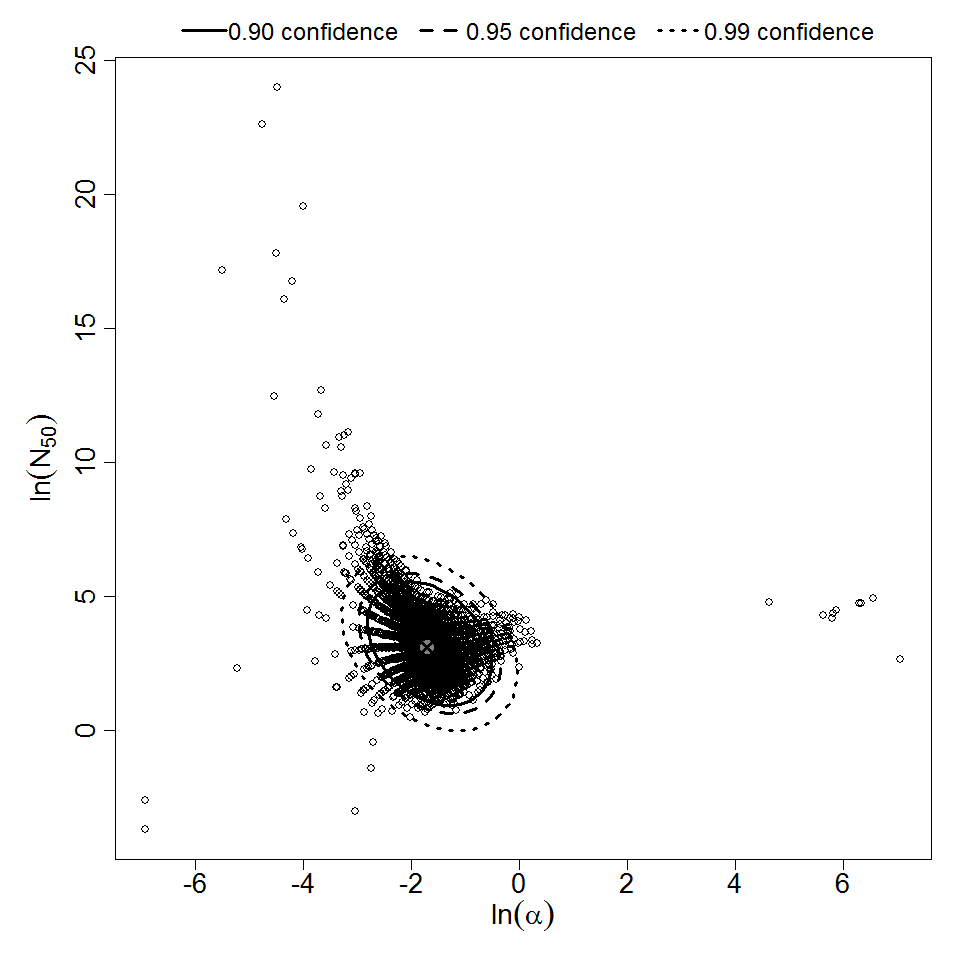
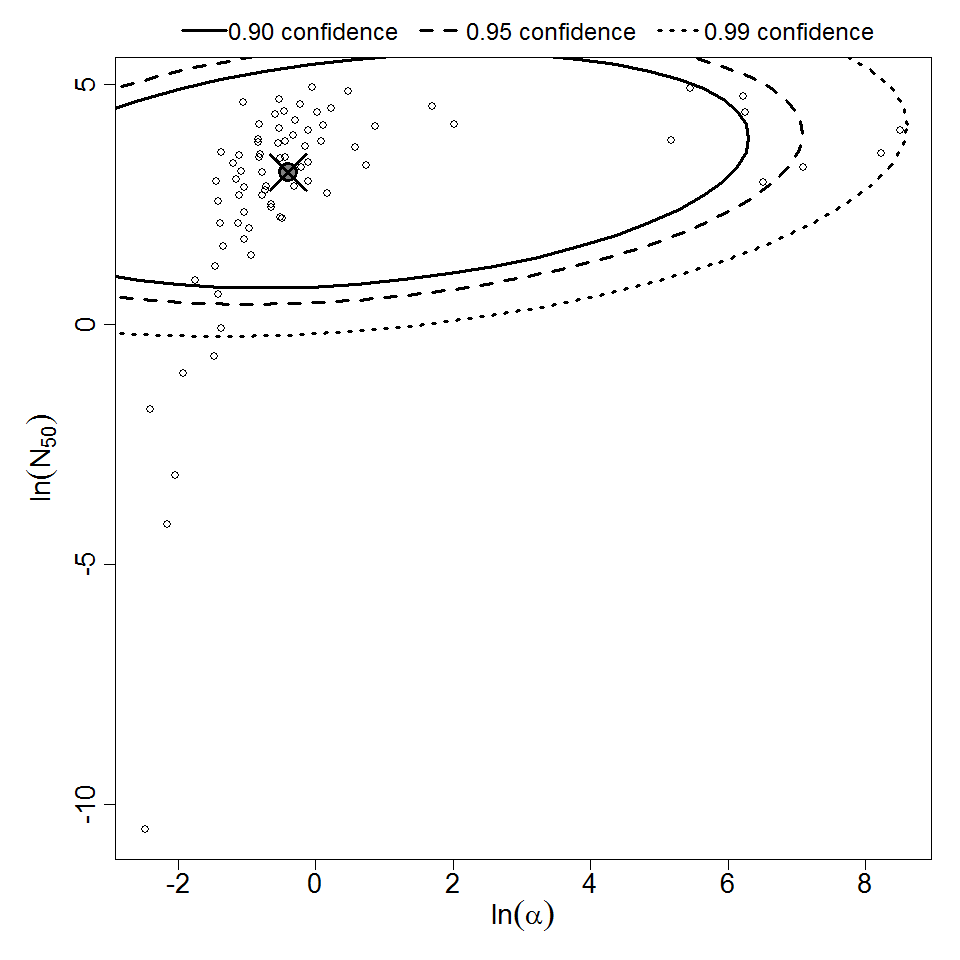
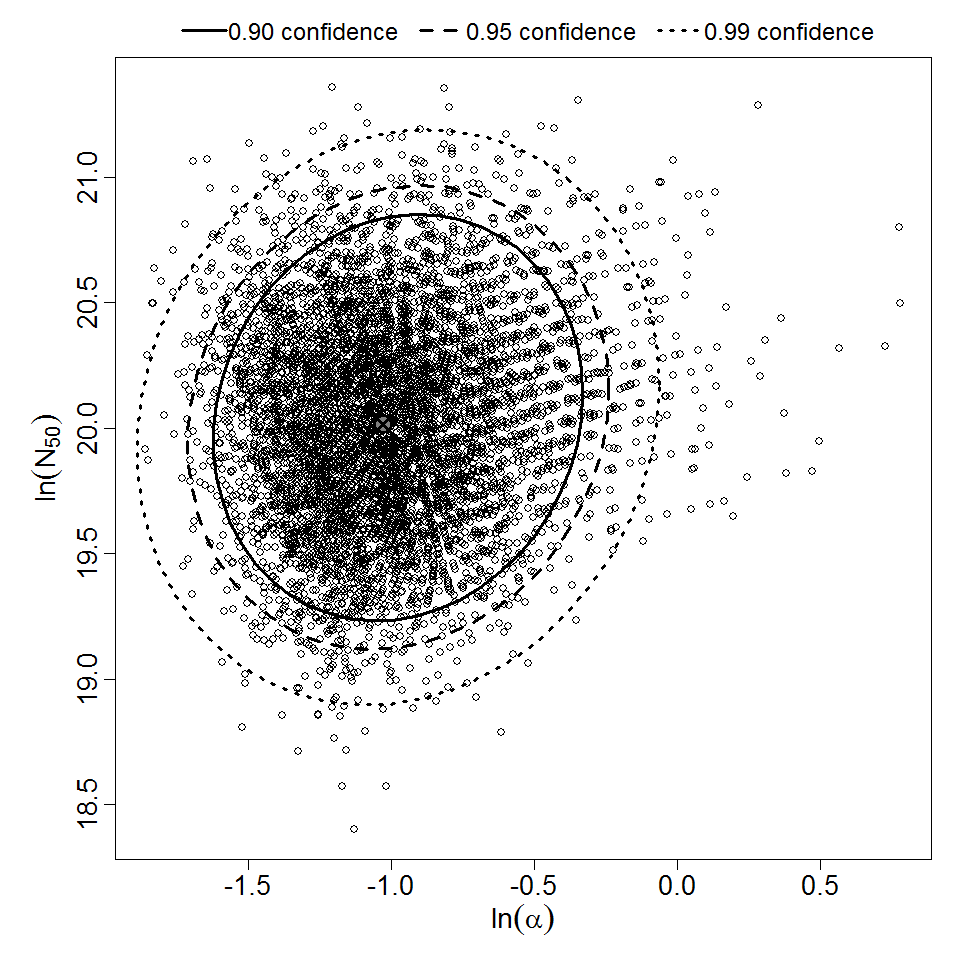
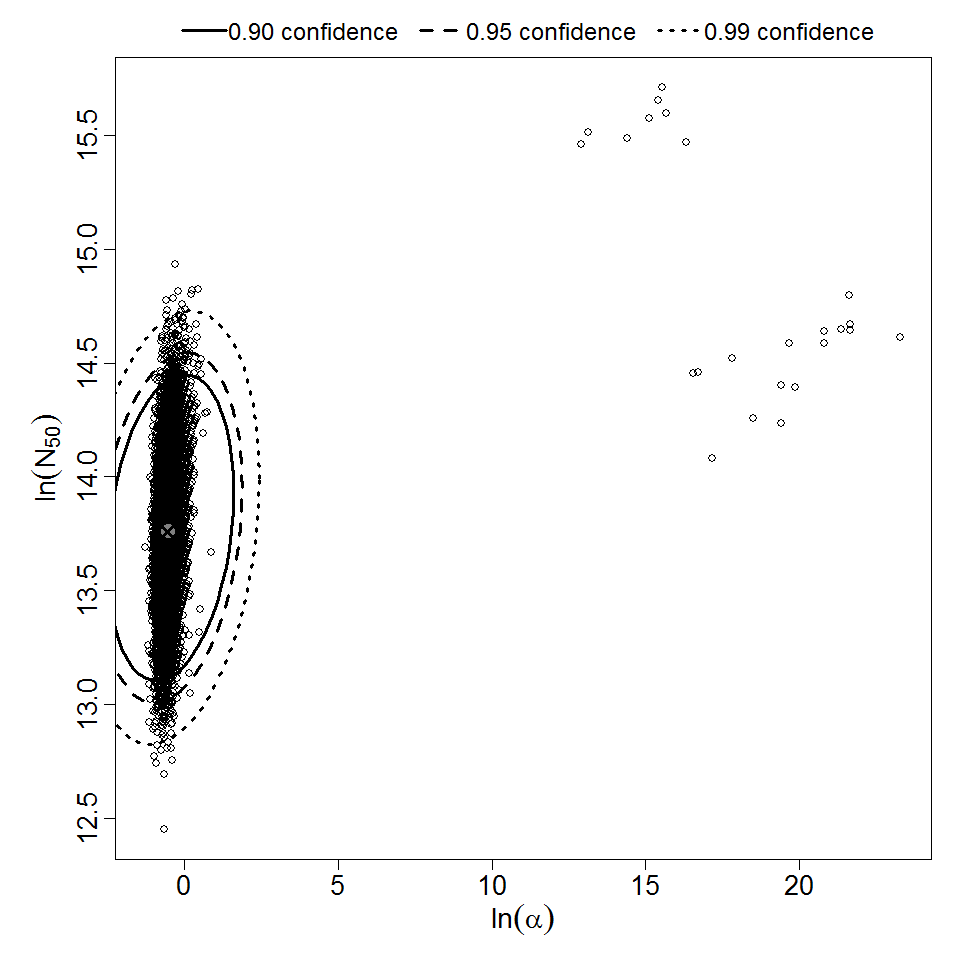
Parameter scatter plot for beta Poisson model ellipses signify the 0.9, 0.95 and 0.99 confidence of the parameters.
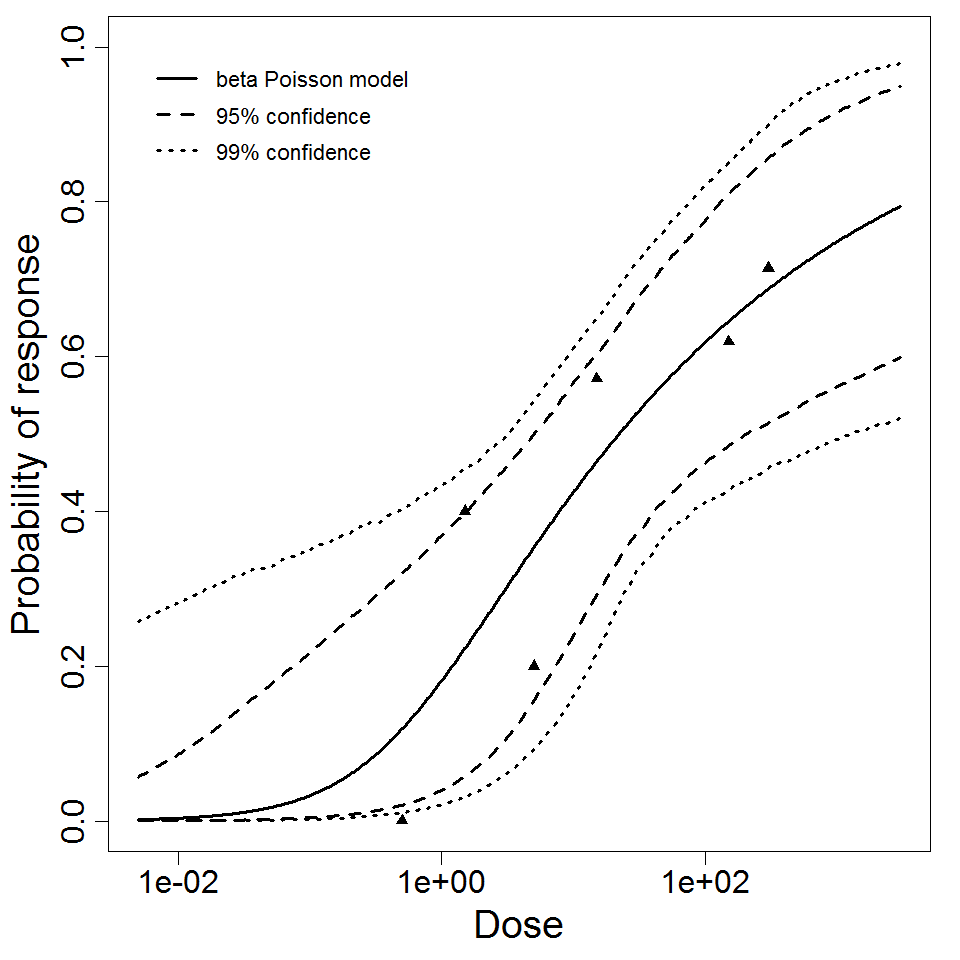
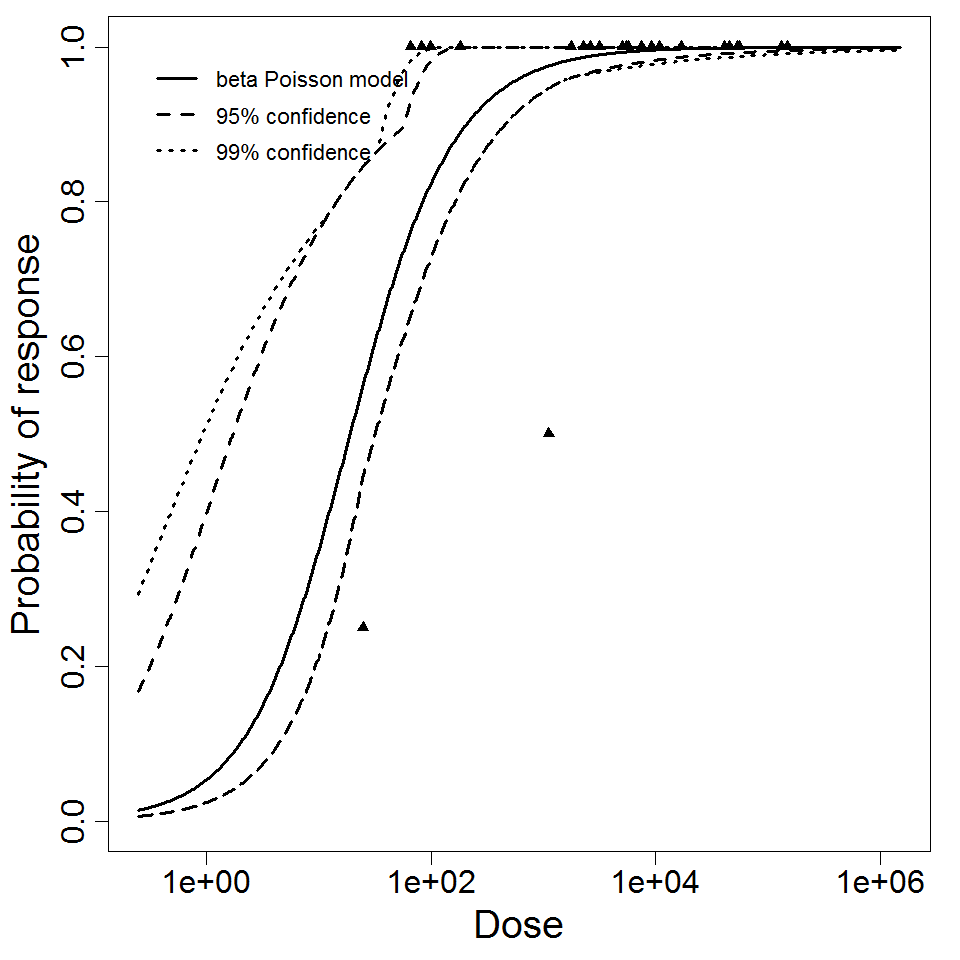
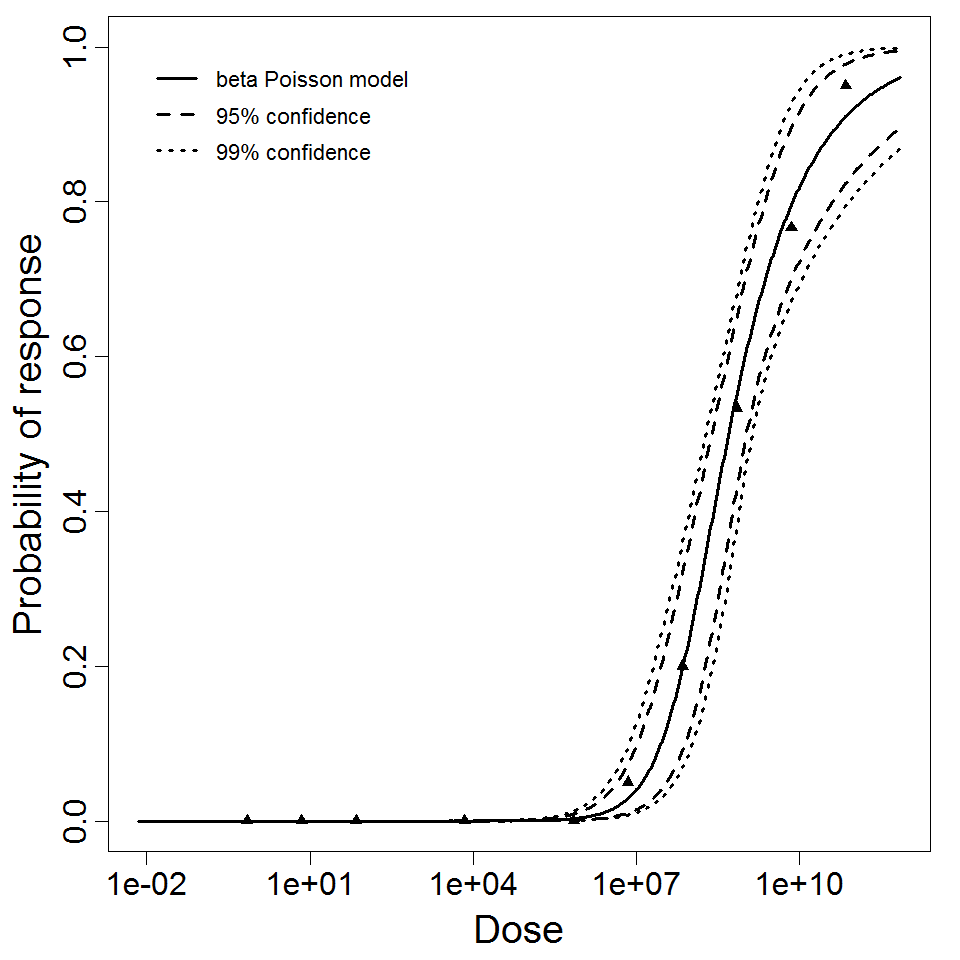
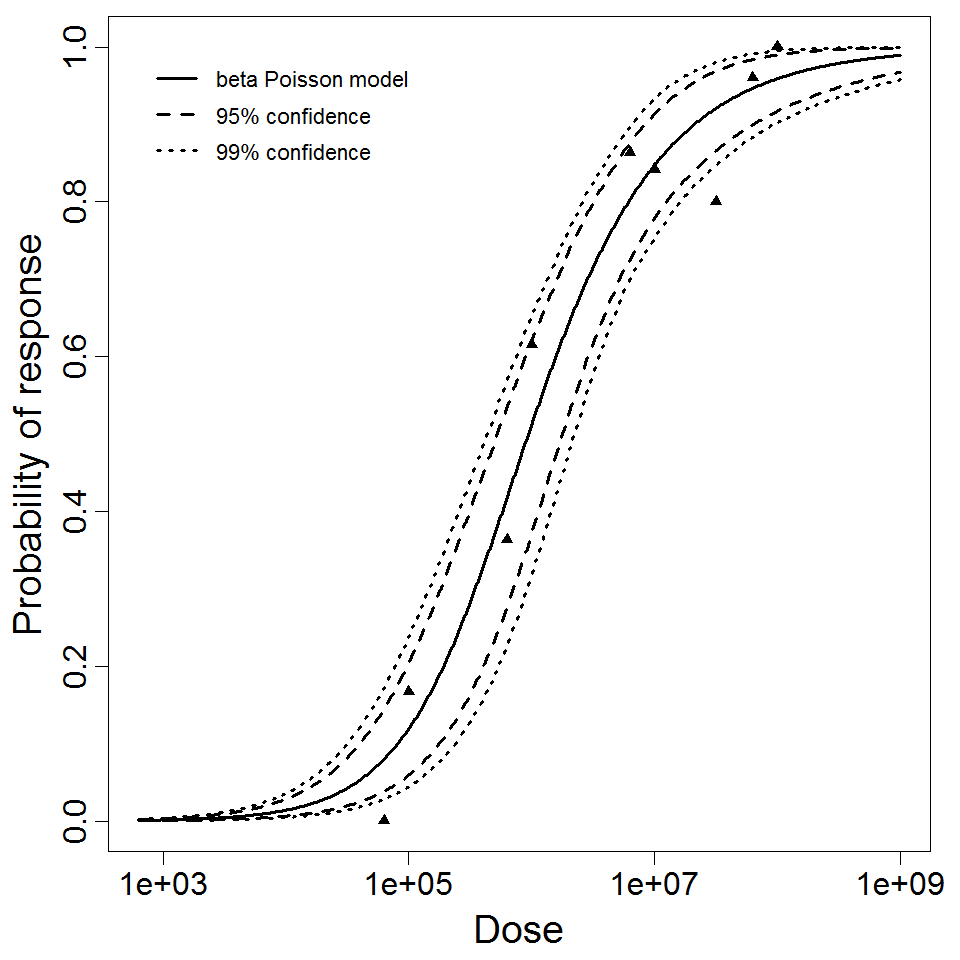
beta Poisson model plot, with confidence bounds around optimized model
# of Doses
6.00
Μodel
N50
2.22E+01
LD50/ID50
2.22E+01
Dose Units
Response
Exposure Route
Contains Preferred Model
a
1.81E-01
Agent Strain
type 14
Experiment ID
312
Host type
Description
Optimization Output for experiment 311
|
|
||||||||||||||||||||||
|
||||||||||||||||||||||||||||||
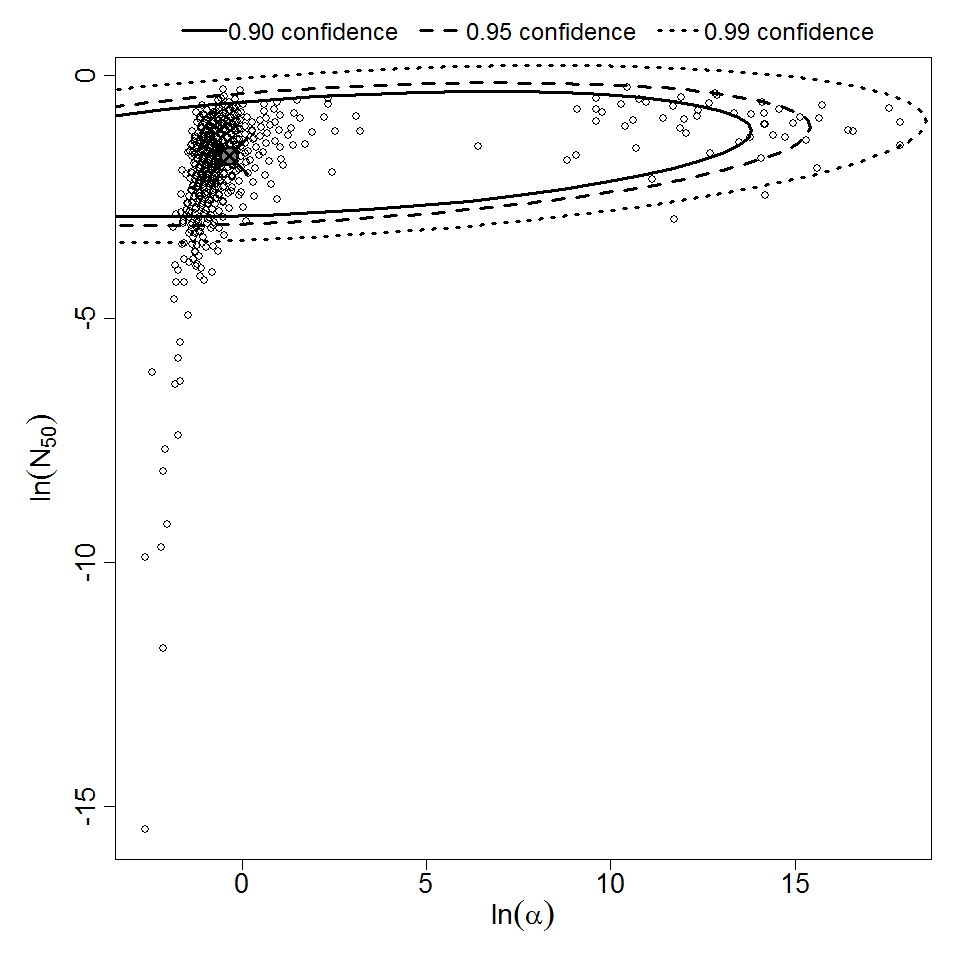
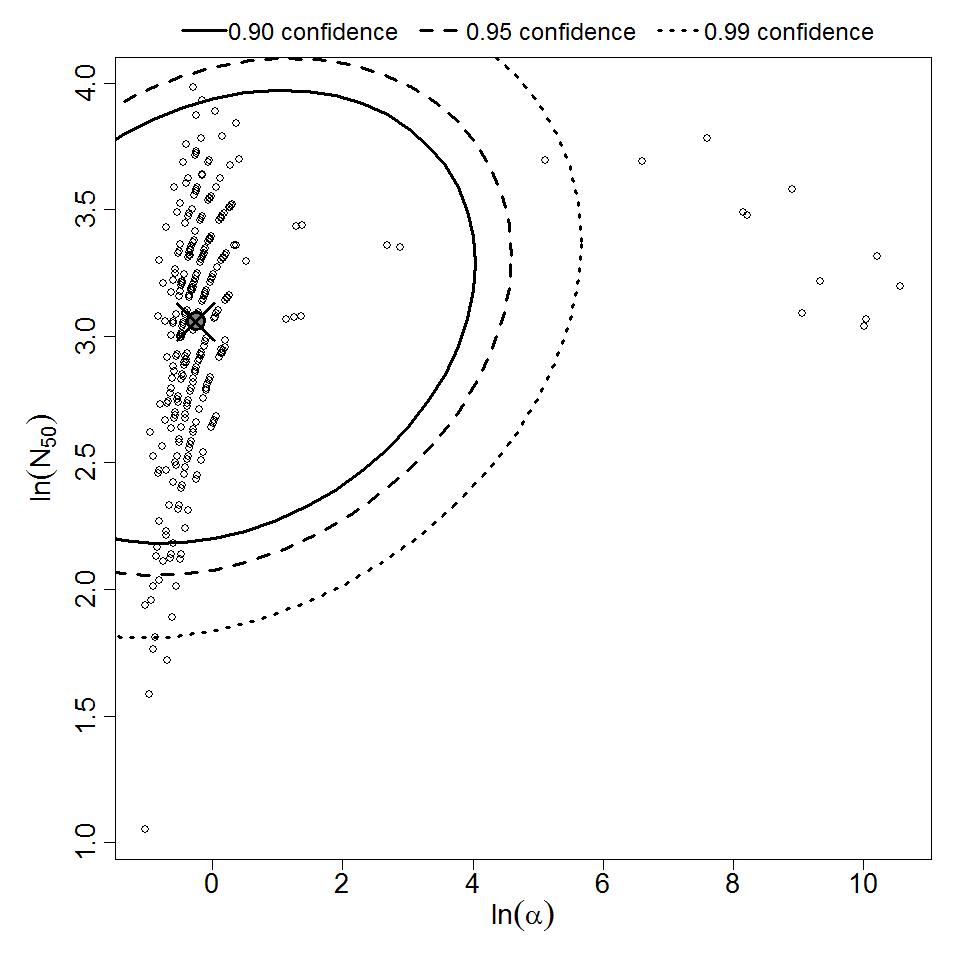
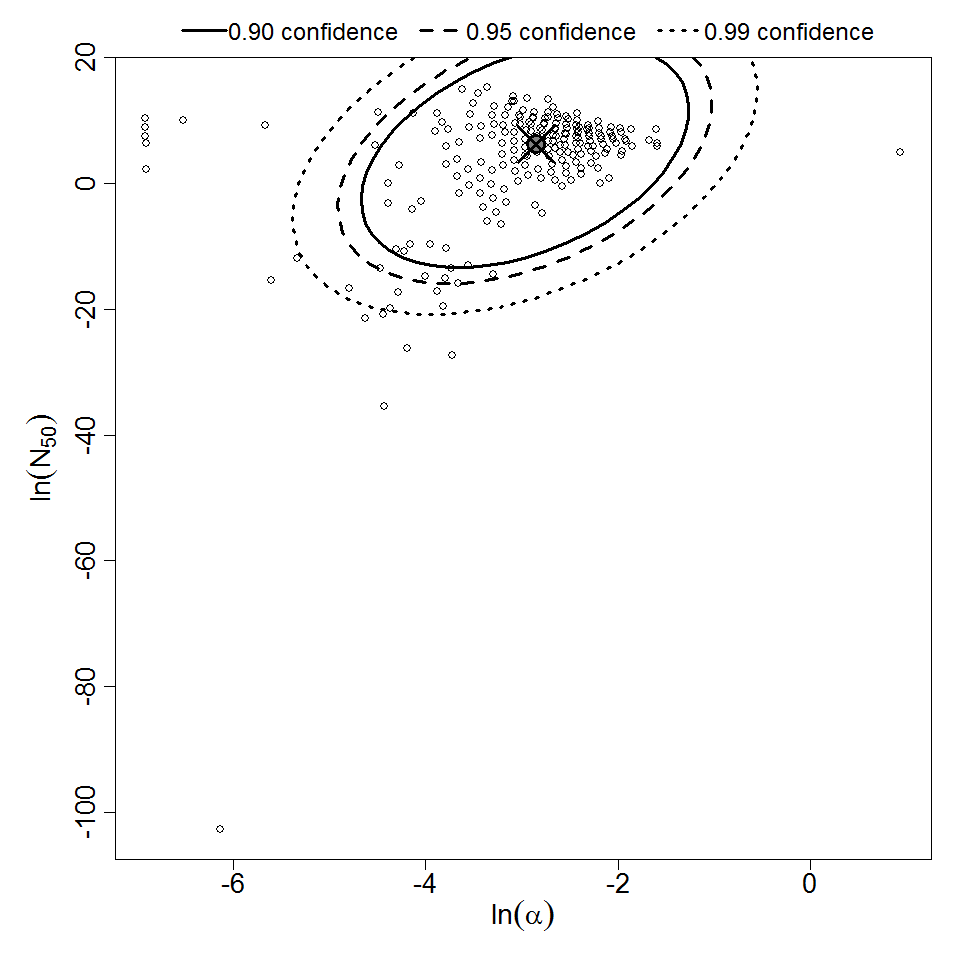
Parameter scatter plot for beta Poisson model ellipses signify the 0.9, 0.95 and 0.99 confidence of the parameters.
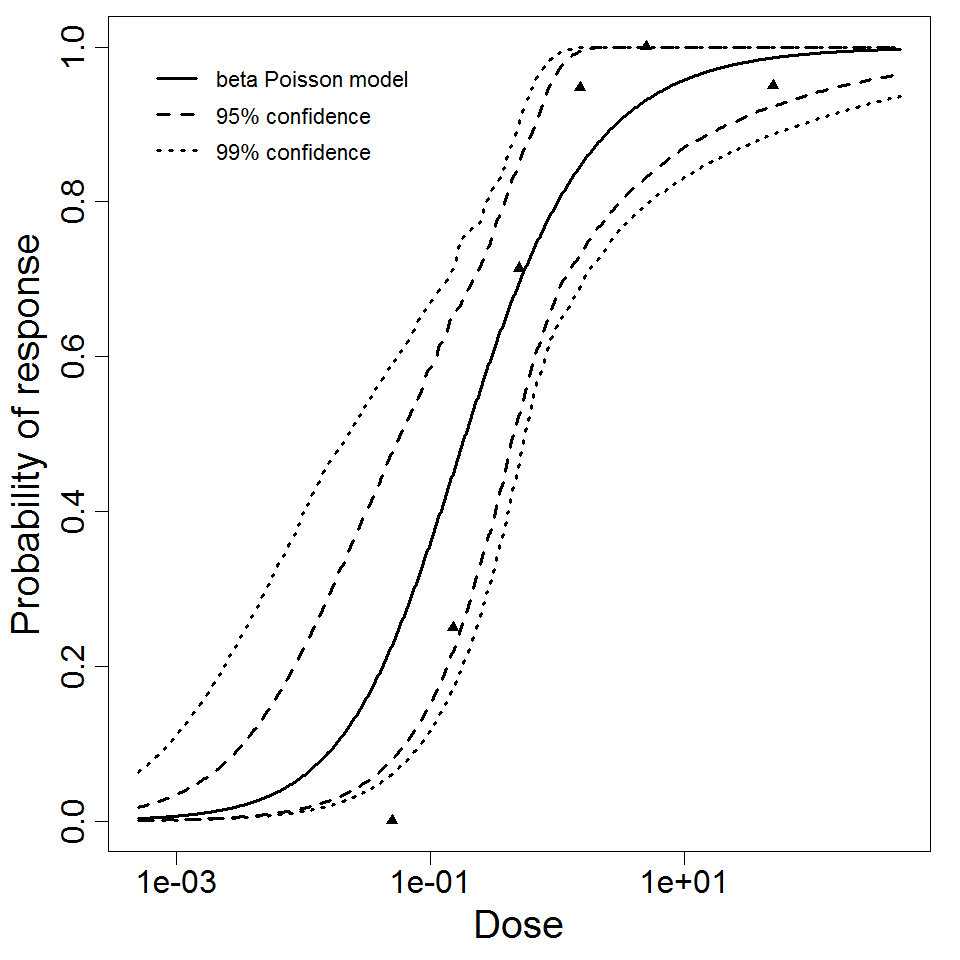
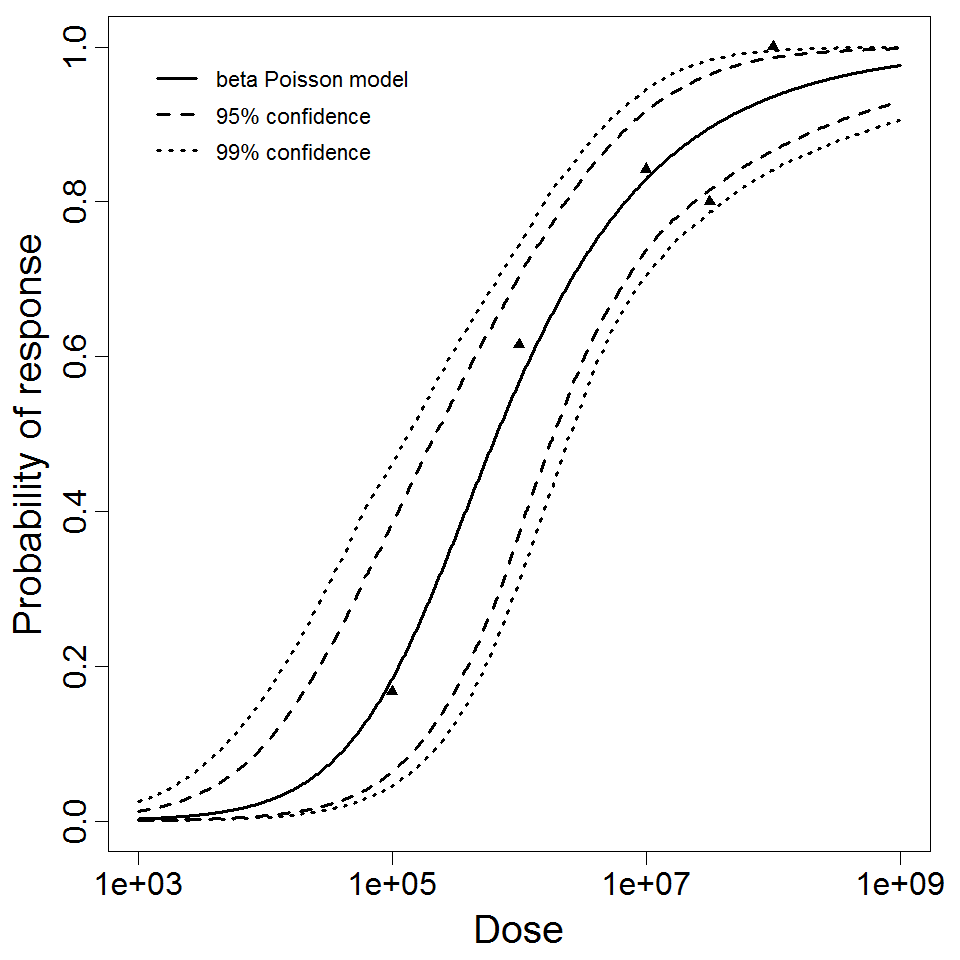
beta Poisson model plot, with confidence bounds around optimized model
# of Doses
6.00
Μodel
N50
1.9E-01
LD50/ID50
1.9E-01
Dose Units
Response
Exposure Route
Contains Preferred Model
a
7.01E-01
Agent Strain
type 39
Experiment ID
311
Host type
Description
|
|
||||||||||||||||||||||
|
||||||||||||||||||||||||||||||

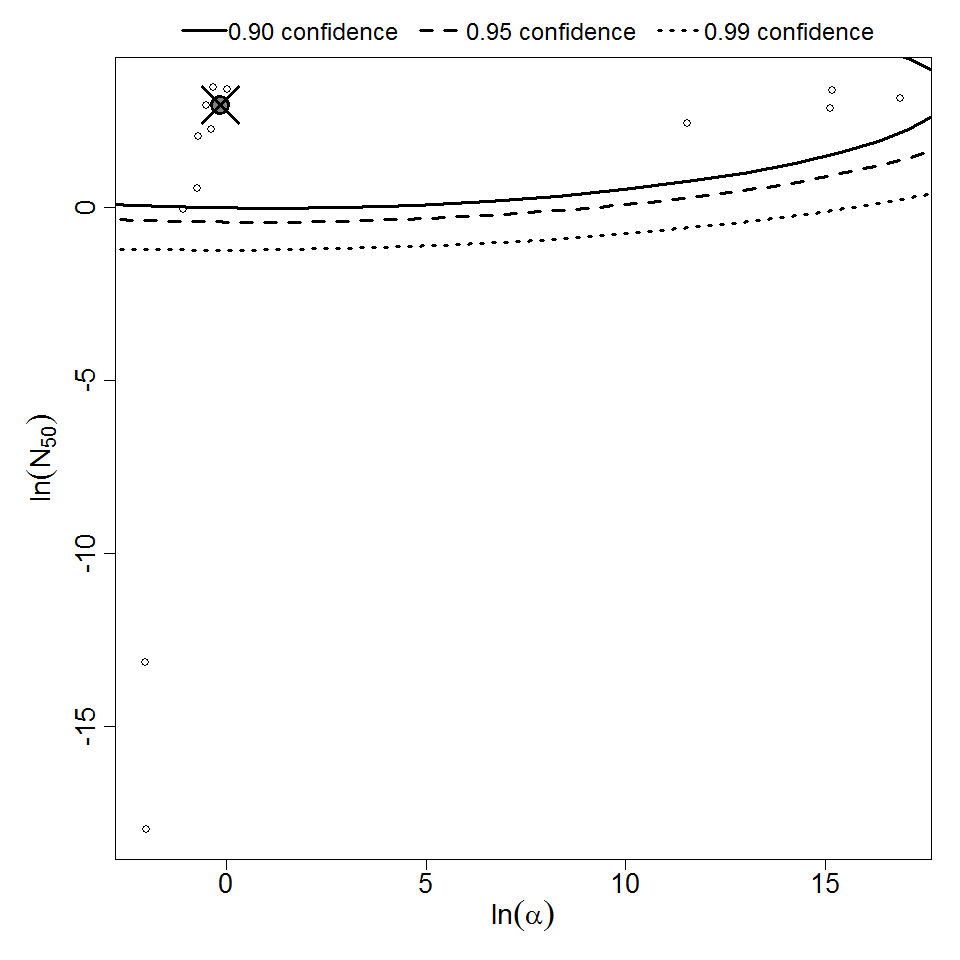
Parameter scatter plot for beta Poisson model ellipses signify the 0.9, 0.95 and 0.99 confidence of the parameters.

beta Poisson model plot, with confidence bounds around optimized model
# of Doses
6.00
Μodel
N50
3.83E+00
LD50/ID50
3.83E+00
Dose Units
Response
Exposure Route
Contains Preferred Model
a
2.52E-01
Agent Strain
type 14
Experiment ID
310
Host type
Description
|
|
||||||||||||||||||||||
|
||||||||||||||||||||||||||||||
Parameter scatter plot for beta Poisson model ellipses signify the 0.9, 0.95 and 0.99 confidence of the parameters.

beta Poisson model plot, with confidence bounds around optimized model
# of Doses
3.00
Μodel
N50
2.36E+01
LD50/ID50
2.36E+01
Dose Units
Response
Exposure Route
Contains Preferred Model
a
6.75E-01
Agent Strain
Sheila Smith
Experiment ID
301
Host type
Description
|
||||||||||||||||||||||
|
||||||||||||||||||||||||||||||
Parameter scatter plot for beta Poisson model ellipses signify the 0.9, 0.95 and 0.99 confidence of the parameters.

beta Poisson model plot, with confidence bounds around optimized model
# of Doses
27.00
Μodel
N50
2.13E+01
LD50/ID50
2.13E+01
Dose Units
Response
Contains Preferred Model
a
7.77E-01
Agent Strain
R1 and Sheila Smith
Experiment ID
300 and 301
Host type
Description
|
|
||||||||||||||||||||||
|
||||||||||||||||||||||||||||||
Parameter scatter plot for beta Poisson model ellipses signify the 0.9, 0.95 and 0.99 confidence of the parameters.
beta Poisson model plot, with confidence bounds around optimized model
# of Doses
24.00
Μodel
N50
1.88E+01
LD50/ID50
1.88E+01
Dose Units
Response
Exposure Route
Contains Preferred Model
a
8.58E-01
Agent Strain
R1
Experiment ID
300
Host type
Description
|
|
||||||||||||||||||||||
|
||||||||||||||||||||||||||||||
Parameter scatter plot for beta Poisson model ellipses signify the 0.9, 0.95 and 0.99 confidence of the parameters.
beta Poisson model plot, with confidence bounds around optimized model
# of Doses
10.00
Μodel
N50
4.93E+08
LD50/ID50
4.93E+08
Dose Units
Response
Exposure Route
Contains Preferred Model
a
3.57E-01
Agent Strain
phase I Ohio
Experiment ID
28
Host type
Description
|
|
||||||||||||||||||||||
|
||||||||||||||||||||||||||||||
Parameter scatter plot for beta Poisson model ellipses signify the 0.9, 0.95 and 0.99 confidence of the parameters

beta Poisson model plot, with confidence bounds around optimized model
# of Doses
3.00
Μodel
N50
4.8E+02
LD50/ID50
4.8E+02
Dose Units
Response
Exposure Route
Contains Preferred Model
a
5.79E-02
Agent Strain
sub sp. Paratuberculosis IOI strain
Experiment ID
263
Host type
Description
|
|
||||||||||||||||||||||
|
||||||||||||||||||||||||||||||

Parameter scatter plot for beta Poisson model ellipses signify the 0.9, 0.95 and 0.99 confidence of the parameters.
beta Poisson model plot, with confidence bounds around optimized model
# of Doses
5.00
Μodel
N50
6.66E+05
LD50/ID50
6.66E+05
Dose Units
Response
Exposure Route
Contains Preferred Model
a
4.29E-01
Agent Strain
H3N2,A/Washington/897/80 attenuated strain
Experiment ID
258
Host type
Description
|
|
||||||||||||||||||||||
|
||||||||||||||||||||||||||||||
Parameter scatter plot for beta Poisson model ellipses signify the 0.9, 0.95 and 0.99 confidence of the parameters.
beta Poisson model plot, with confidence bounds around optimized model
# of Doses
9.00
Μodel
N50
9.45E+05
LD50/ID50
9.45E+05
Dose Units
Response
Exposure Route
Contains Preferred Model
a
5.81E-01
Agent Strain
H1N1,A/California/10/78 attenuated strain,H3N2,A/Washington/897/80 attenuated strain
Experiment ID
257, 258
Host type