$$P(response)=1-[1+dose\frac{2^{\frac{1}{a}}-1}{N^{50}} ]^{-a}$$
Description
|
|
||||||||||||||||||||||
|
||||||||||||||||||||||||||||||

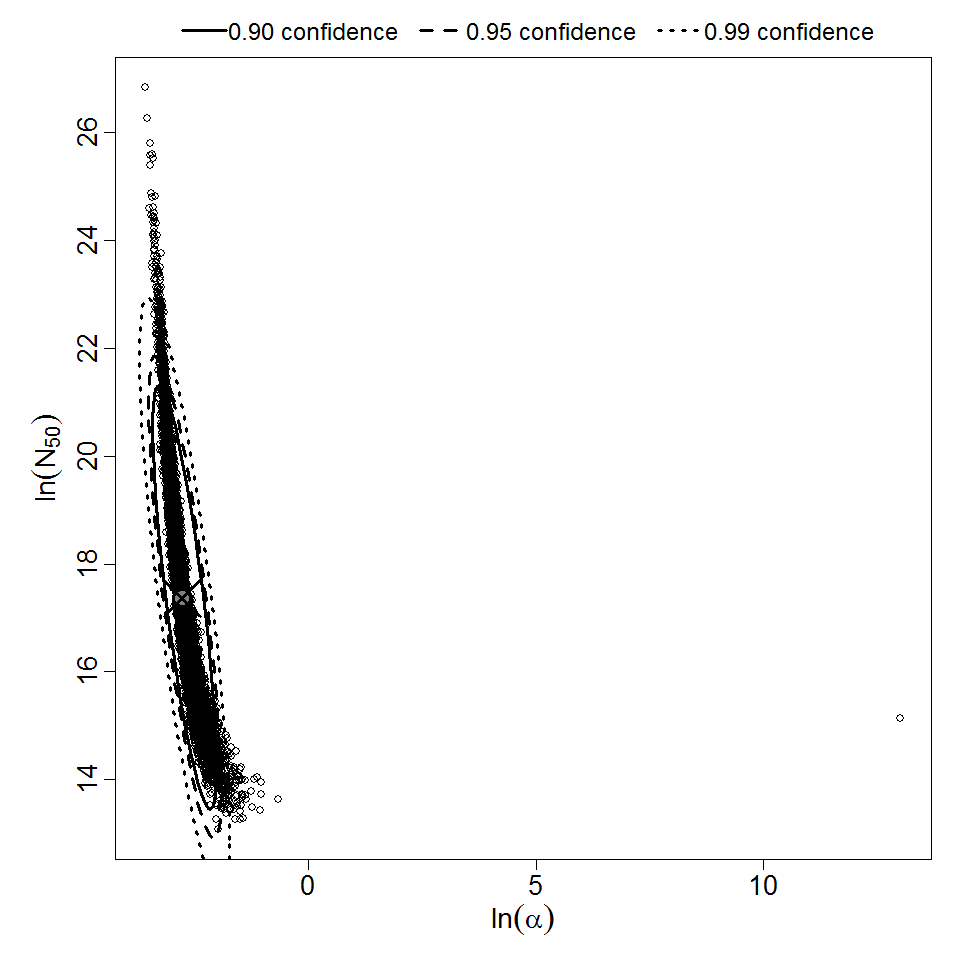
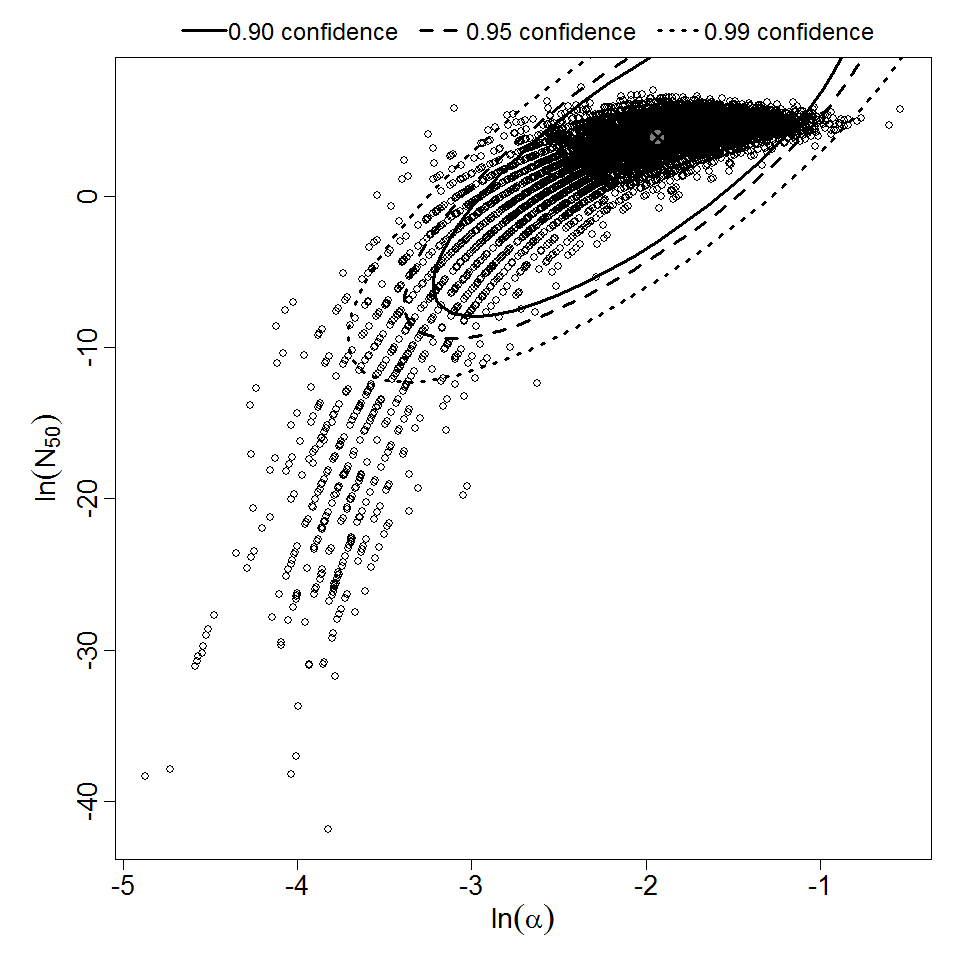
Parameter scatter plot for beta Poisson model ellipses signify the 0.9, 0.95 and 0.99 confidence of the parameters.

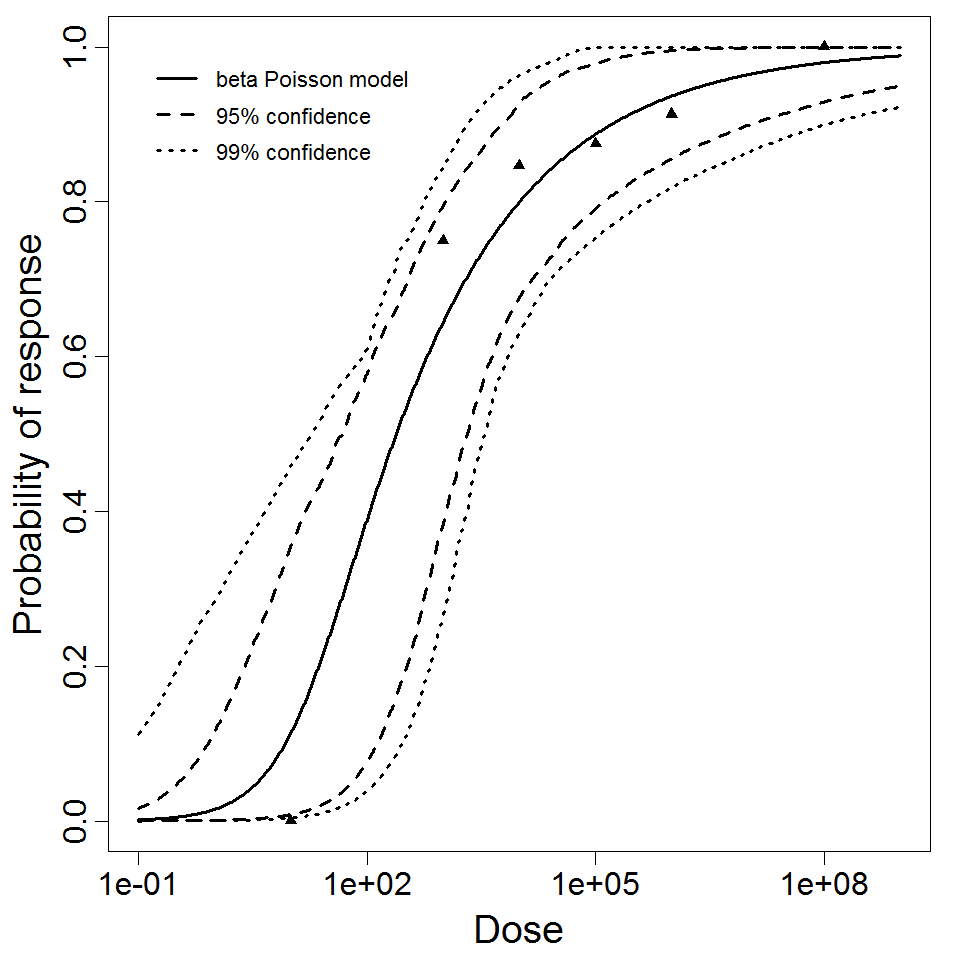
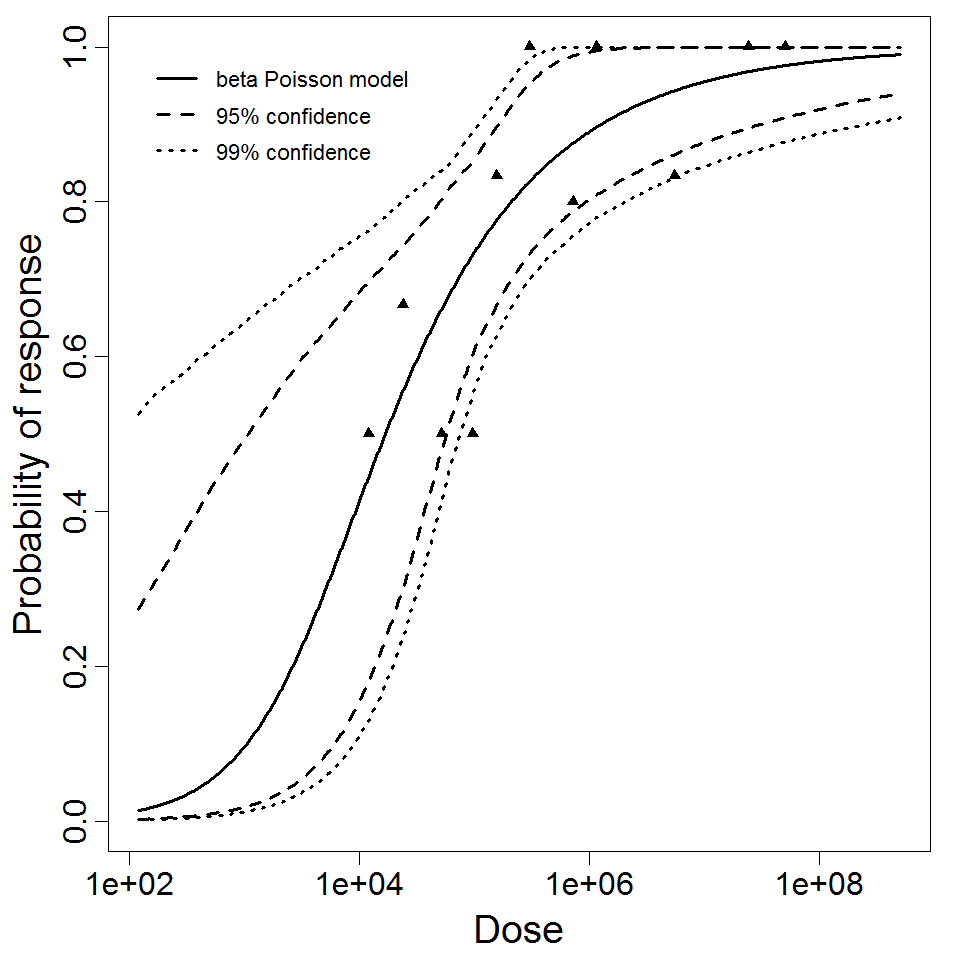
beta Poisson model plot, with confidence bounds around optimized model
# of Doses
4.00
Μodel
N50
1.25E+06
LD50/ID50
1.25E+06
Dose Units
Response
Exposure Route
Contains Preferred Model
a
9.04E-01
Agent Strain
H1N1,A/California/10/78 attenuated strain
Experiment ID
257
Host type
Description
|
|
||||||||||||||||||||||
|
||||||||||||||||||||||||||||||
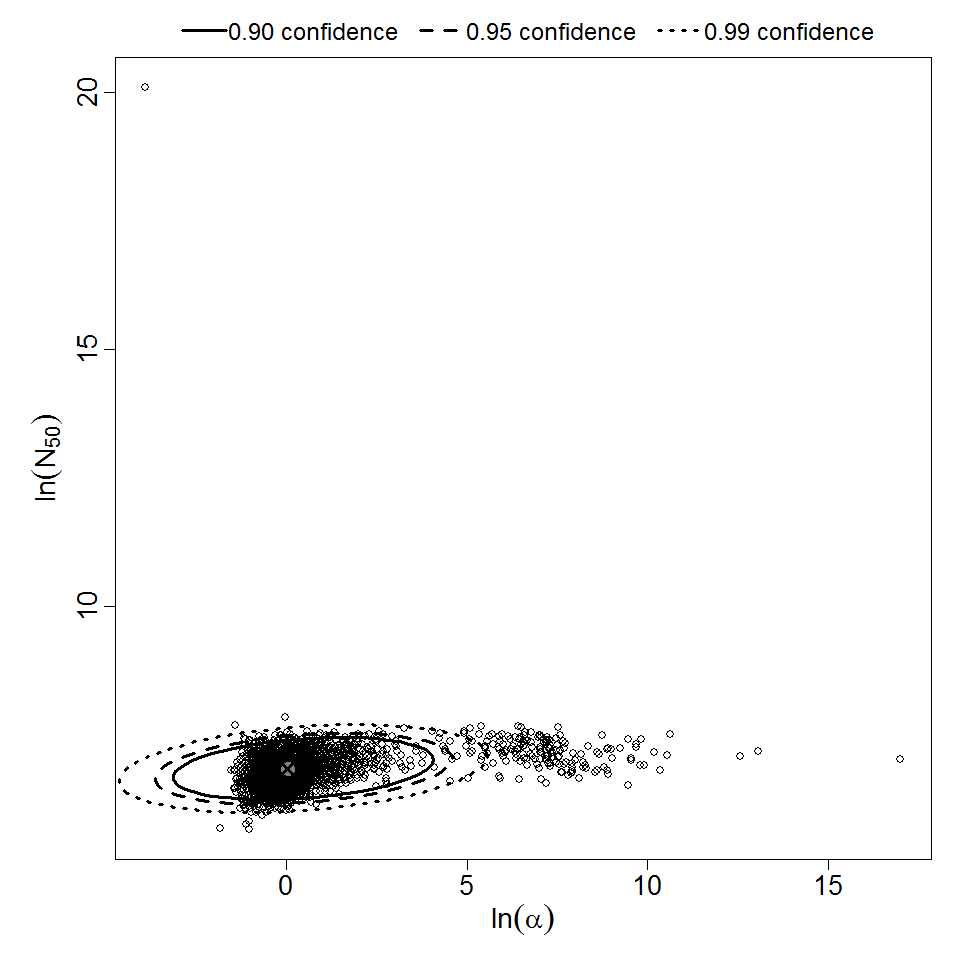
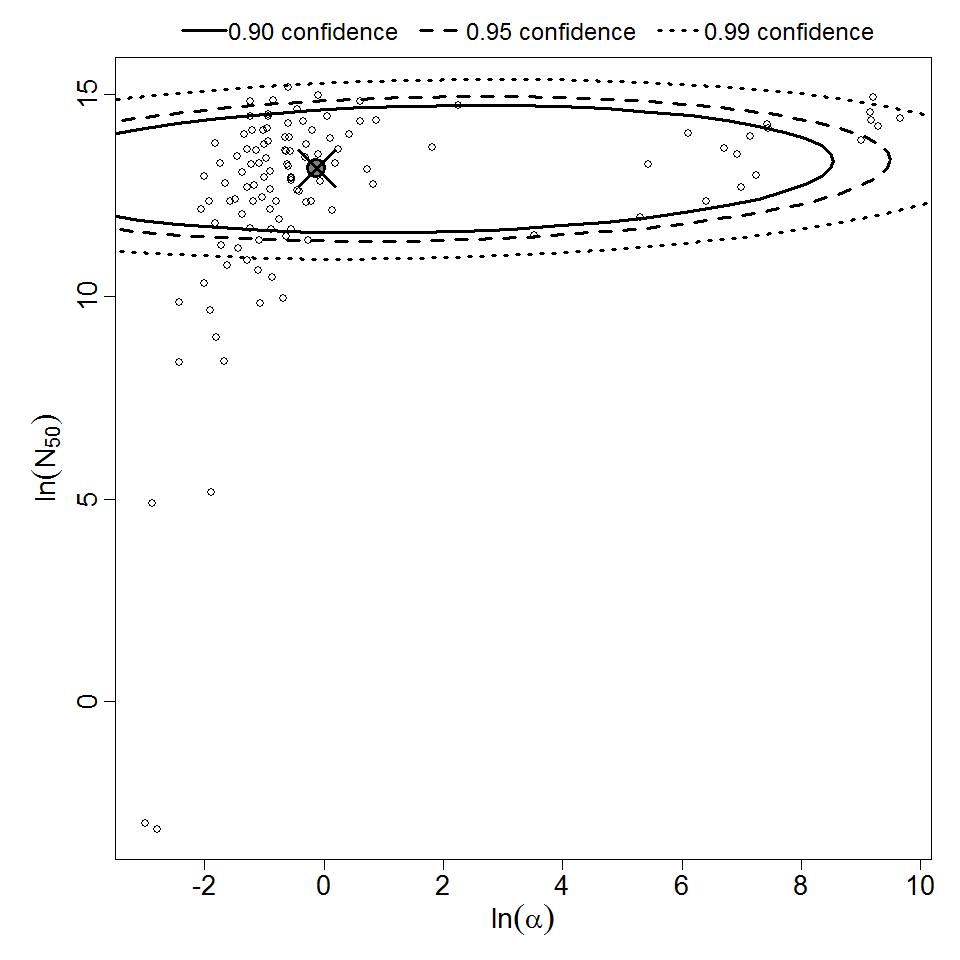
Parameter scatter plot for beta Poisson model ellipses signify the 0.9, 0.95 and 0.99 confidence of the parameters.
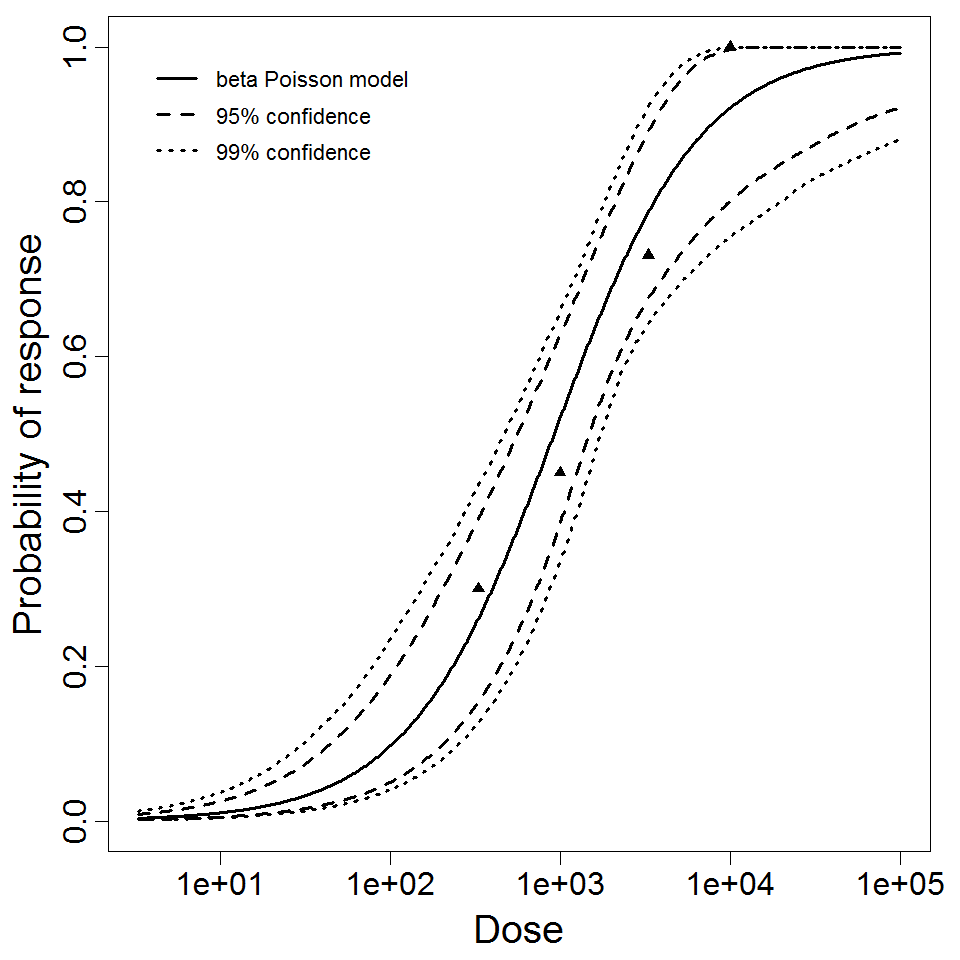
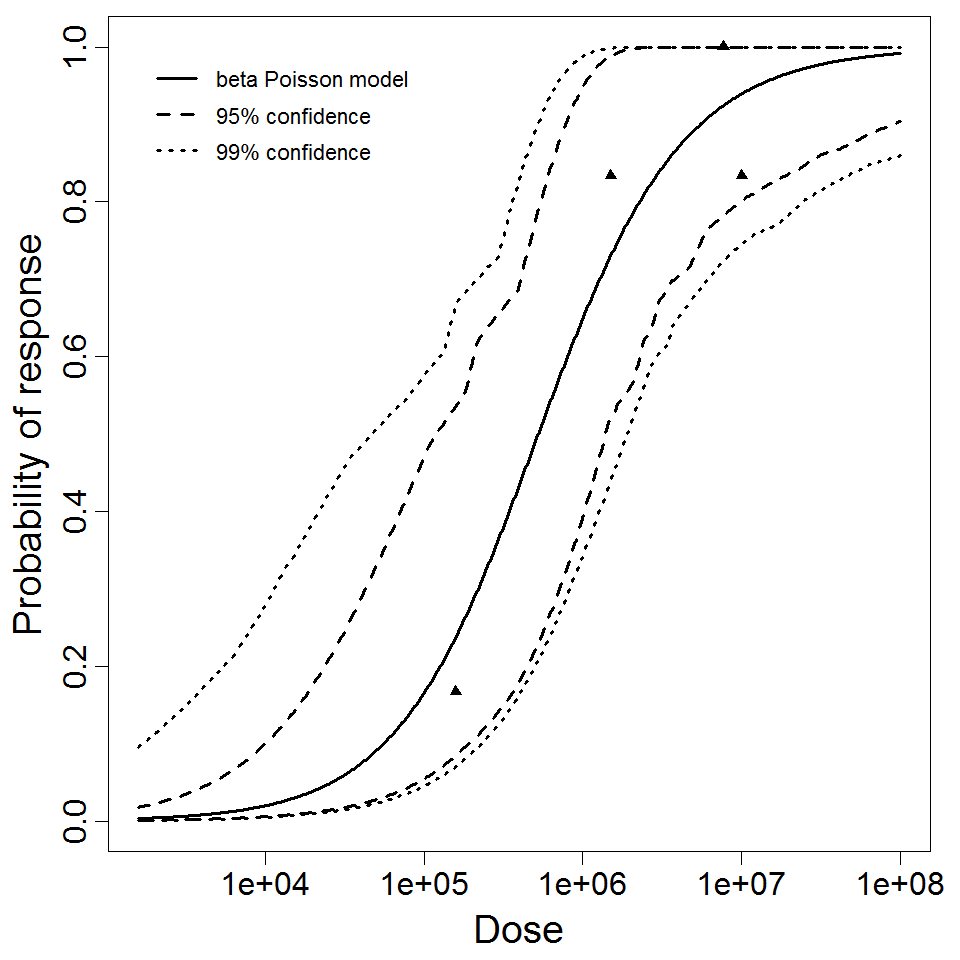
beta Poisson model plot, with confidence bounds around optimized model
# of Doses
4.00
Μodel
N50
9.22E+02
LD50/ID50
9.22E+02
Dose Units
Response
Exposure Route
Contains Preferred Model
a
1.06E+00
Agent Strain
strain 12
Experiment ID
256 (excluding the outliers of exp 112)
Host type
Description
|
|
||||||||||||||||||||||
|
||||||||||||||||||||||||||||||
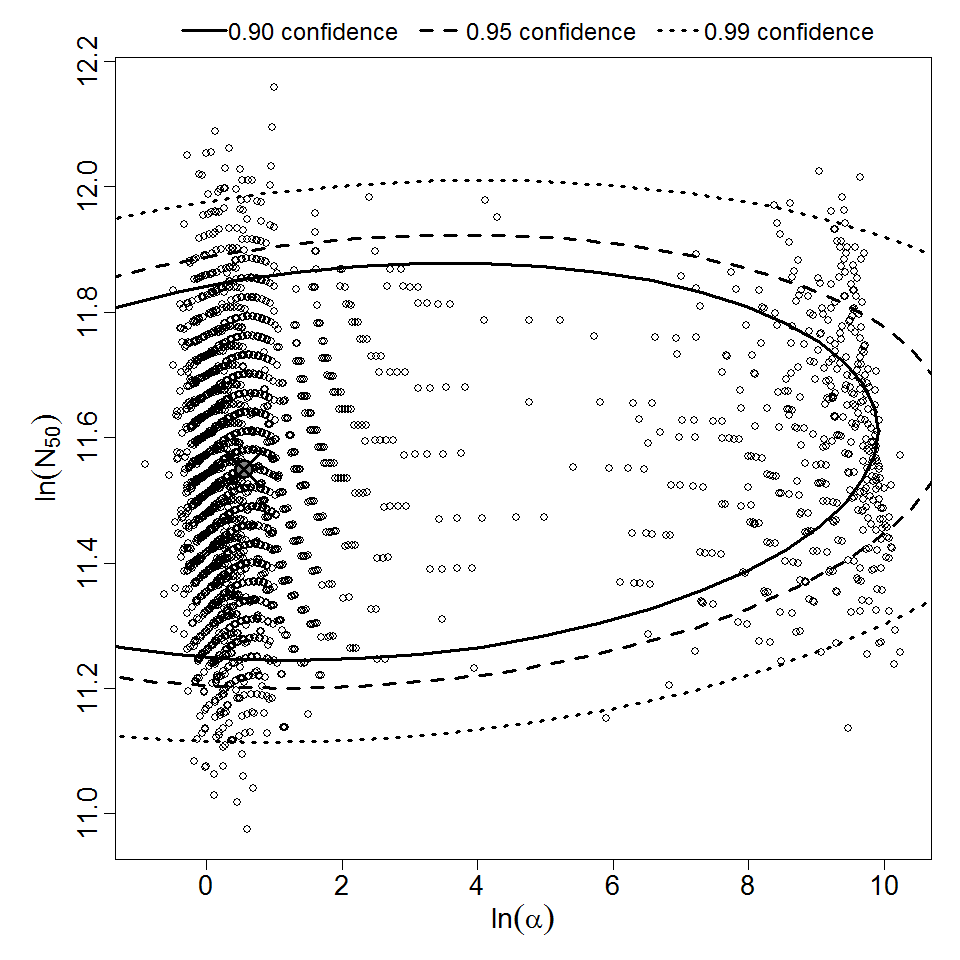
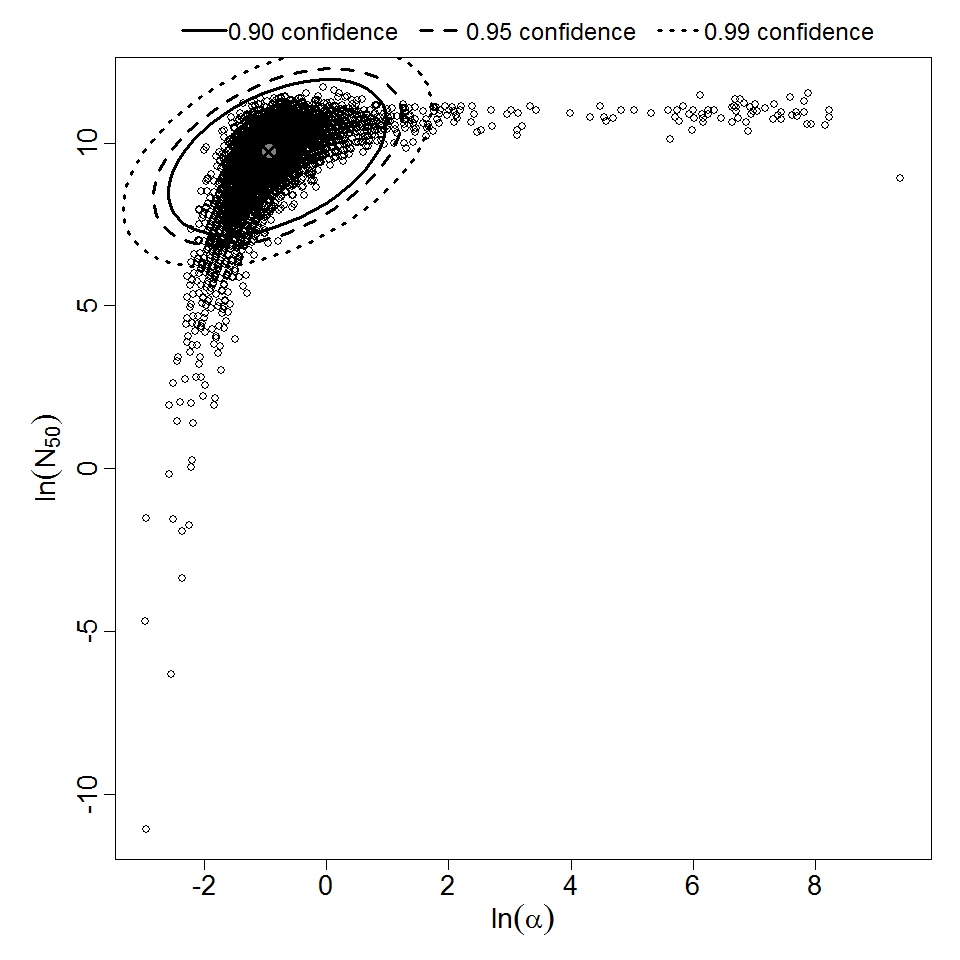
Parameter scatter plot for beta Poisson model ellipses signify the 0.9, 0.95 and 0.99 confidence of the parameters.
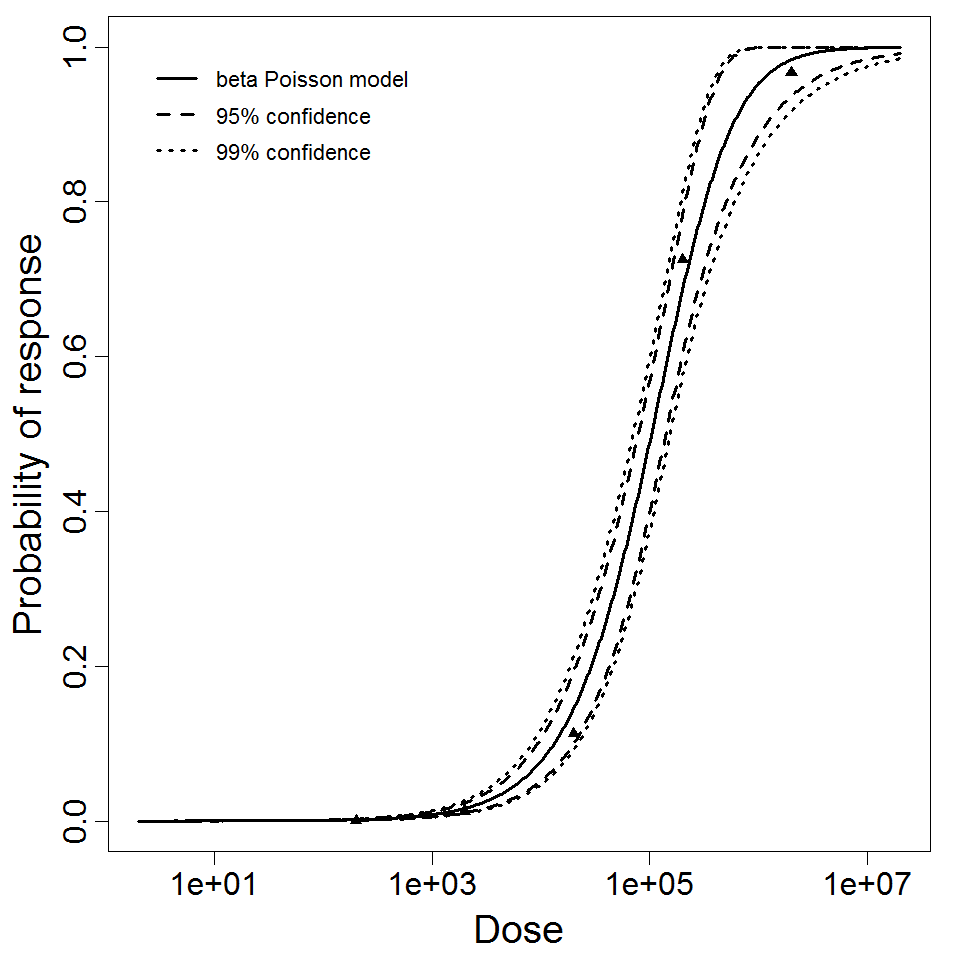
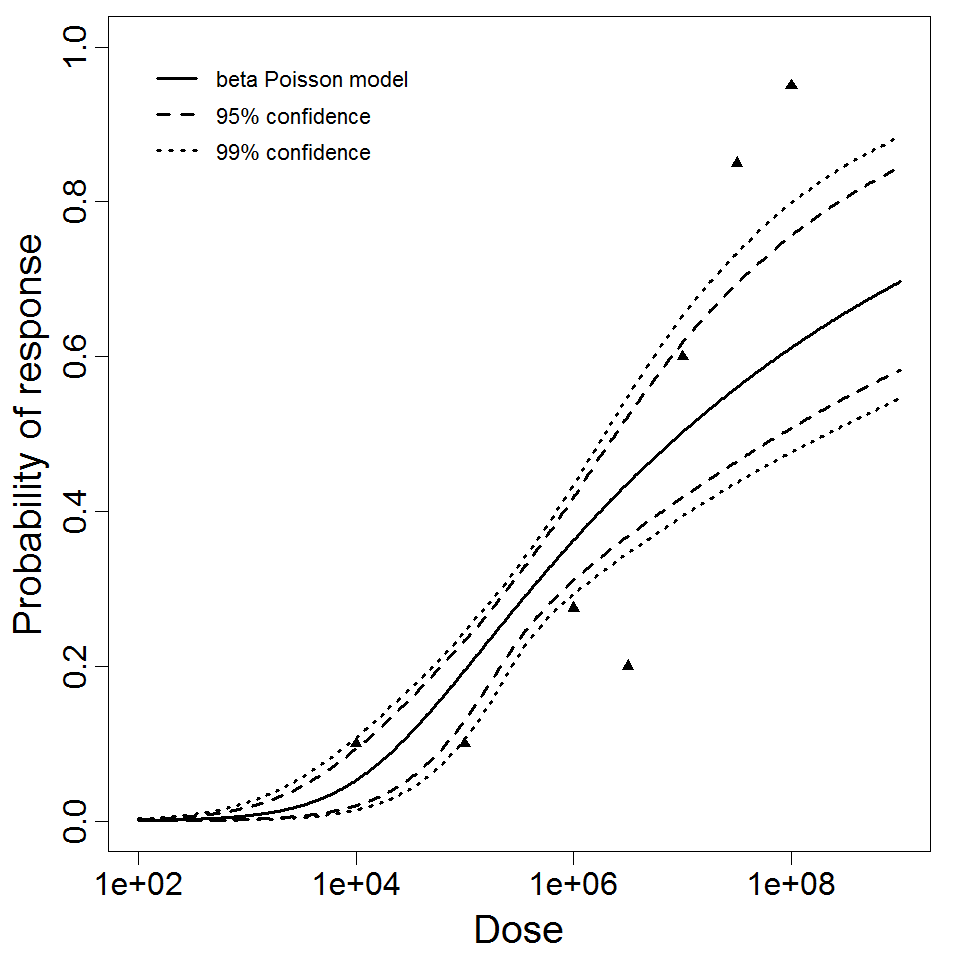
beta Poisson model plot, with confidence bounds around optimized model
# of Doses
5.00
Μodel
N50
1.04E+05
LD50/ID50
1.04E+05
Dose Units
Response
Exposure Route
Contains Preferred Model
a
1.76E+00
Agent Strain
scrapie strain 263k
Experiment ID
250
Host type
Description
|
|
||||||||||||||||||||||
|
||||||||||||||||||||||||||||||

Parameter scatter plot for beta Poisson model ellipses signify the 0.9, 0.95 and 0.99 confidence of the parameters.
beta Poisson model plot, with confidence bounds around optimized model
# of Doses
6.00
Μodel
N50
2.43E+02
LD50/ID50
2.43E+02
Dose Units
Response
Exposure Route
Contains Preferred Model
a
2.50E-01
Agent Strain
Inaba 569B
Experiment ID
249
Host type
Description
|
|
||||||||||||||||||||||
|
||||||||||||||||||||||||||||||

Parameter scatter plot for beta Poisson model ellipses signify the 0.9, 0.95 and 0.99 confidence of the parameters.
beta Poisson model plot, with confidence bounds around optimized model
# of Doses
7.00
Μodel
N50
9.66E+06
LD50/ID50
9.66E+06
Dose Units
Response
Exposure Route
Contains Preferred Model
a
1.08E-01
Agent Strain
strain 533
Experiment ID
248
Host type
Description
|
||||||||||||||||||||||
|
||||||||||||||||||||||||||||||
Parameter scatter plot for beta Poisson model ellipses signify the 0.9, 0.95 and 0.99 confidence of the parameters.
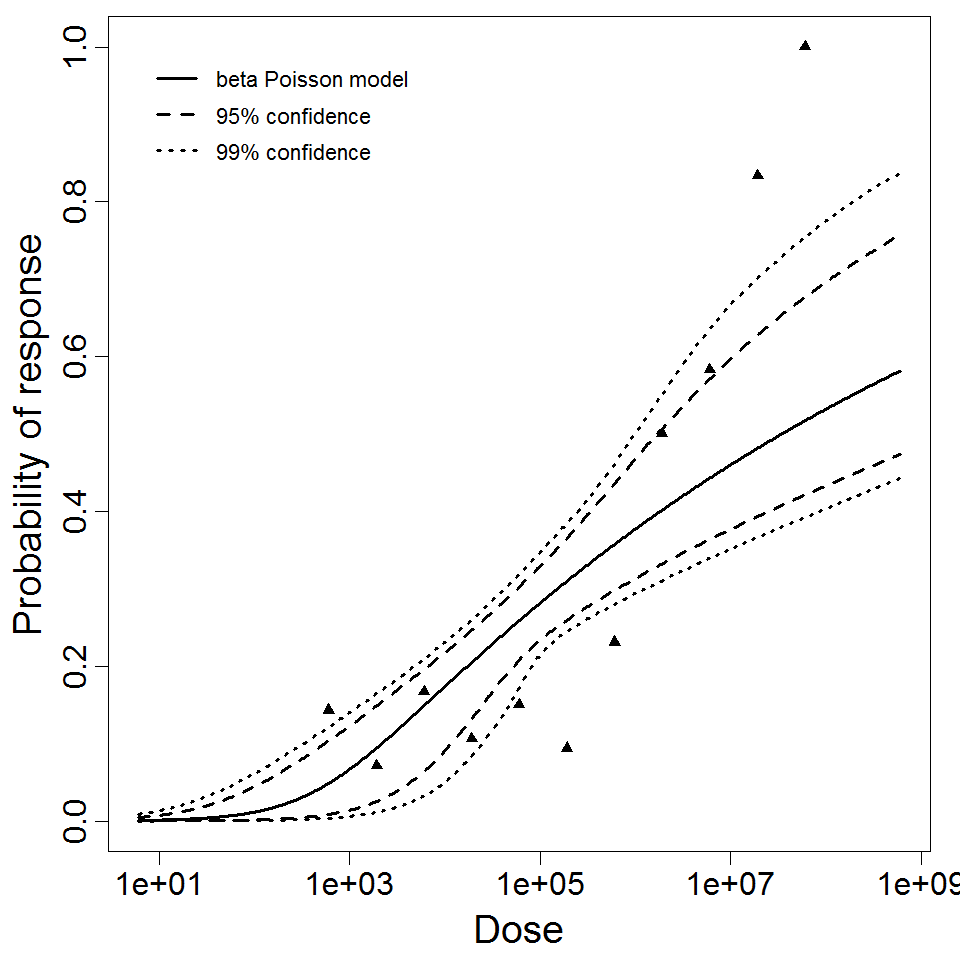
beta Poisson model plot, with confidence bounds around optimized model
# of Doses
11.00
Μodel
N50
3.46E+07
LD50/ID50
3.46E+07
Dose Units
Response
Exposure Route
Contains Preferred Model
a
6.21E-02
Agent Strain
strain 533
Experiment ID
247
Host type
Description
|
|
||||||||||||||||||||||
|
||||||||||||||||||||||||||||||

Parameter scatter plot for beta Poisson model ellipses signify the 0.9, 0.95 and 0.99 confidence of the parameters.

beta Poisson model plot, with confidence bounds around optimized model
# of Doses
10.00
Μodel
N50
4.98E+01
LD50/ID50
4.98E+01
Dose Units
Response
Exposure Route
Contains Preferred Model
a
2.1E-01
Agent Strain
strain 216 and 219
Experiment ID
246
Host type
Description
|
|
||||||||||||||||||||||
|
||||||||||||||||||||||||||||||
Parameter scatter plot for beta Poisson model ellipses signify the 0.9, 0.95 and 0.99 confidence of the parameters.

beta Poisson model plot, with confidence bounds around optimized model
# of Doses
24.00
Μodel
N50
5.01E+01
LD50/ID50
5.01E+01
Dose Units
Response
Exposure Route
Contains Preferred Model
a
1.45E-01
Agent Strain
NA
Experiment ID
244
Host type
Description
|
|
||||||||||||||||||||||
|
||||||||||||||||||||||||||||||
Parameter scatter plot for beta Poisson model ellipses signify the 0.9, 0.95 and 0.99 confidence of the parameters.
beta Poisson model plot, with confidence bounds around optimized model
# of Doses
4.00
Μodel
N50
5.24E+05
LD50/ID50
5.24E+05
Dose Units
Response
Exposure Route
Contains Preferred Model
a
8.85E-01
Agent Strain
strain III
Experiment ID
240
Host type
Description
|
|
||||||||||||||||||||||
|
||||||||||||||||||||||||||||||
Parameter scatter plot for beta Poisson model ellipses signify the 0.9, 0.95 and 0.99 confidence of the parameters.
beta Poisson model plot, with confidence bounds around optimized model
# of Doses
11.00
Μodel
N50
1.68E+04
LD50/ID50
1.68E+04
Dose Units
Response
Exposure Route
Contains Preferred Model
a
3.89E-01
Agent Strain
strain I
Experiment ID
238
Host type