Description

Červa (1967a,b) studied white mice of the Czechoslovak H-strain weighing 13-15 grams inoculated intranasally by placing 0.02 mL of the A1 strain of Acanthamoeba over the nares of the ethyl-ether anesthetized mice (Cerva, 1967b).

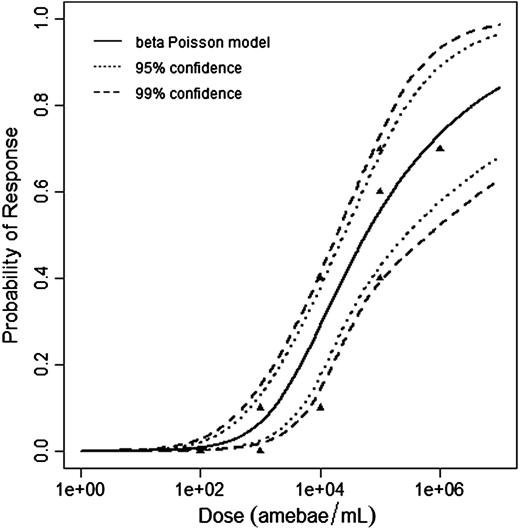
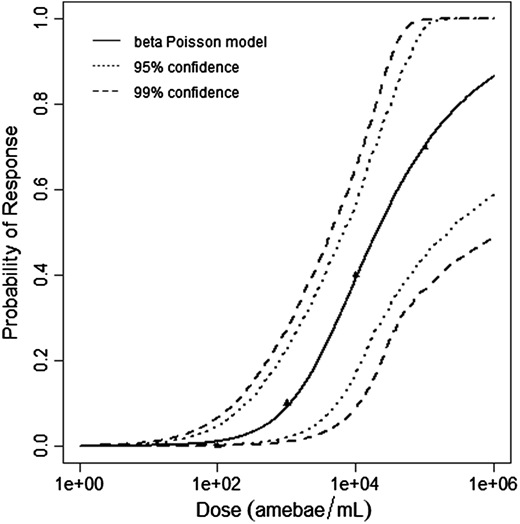
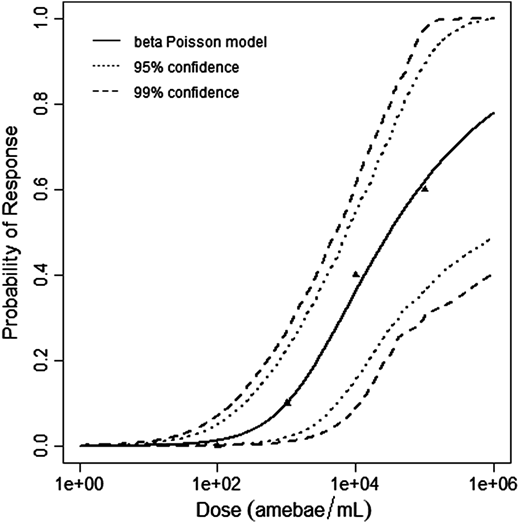
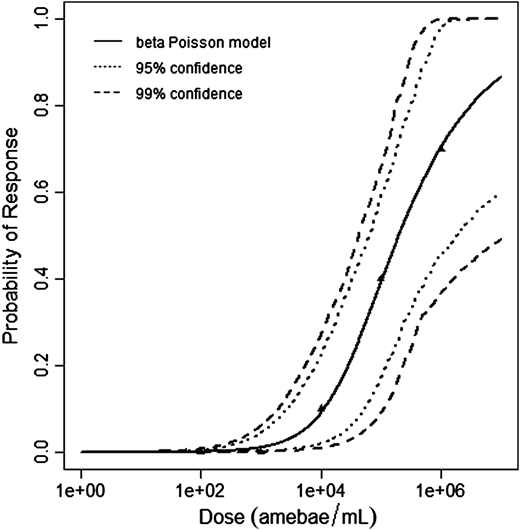
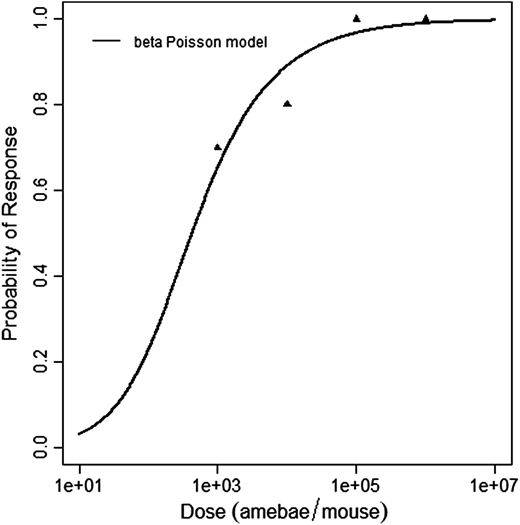
The beta-Poisson model provided the best fit to the data. 


Cerva, L. (1967b). Intranasal, Intrapulmonary, and Intracardial Inoculation of Experimental Animals with Hartmanella castellanii. Folia Parasitologica (Praha), 14, 207–215.

# of Doses
6.00
Μodel
N50
14,690 or 14,538
Dose Units
Response
Exposure Route
Contains Preferred Model
Status
fitted
a
0.161
Agent Strain
A. culbertsoni (A1)
Experiment ID
Acanth_Intranasal1
Host type
Experiment Dataset
Dose (no. of organisms) Positive Response Negative Response Total Subjects/Responses
3 0 20 20
30 2 18 20
300 1 19 20
3000 9 11 20
Description

Culbertson et al. (1966) studied the pathogenicity of the HN-3 strain of A. castellanii (Culbertson et al., 1966; Marciano-Cabral & Cabral, 2003) on ether-anesthetized-specific-pathogen-free (SPF) mice. Cultures of amebae were grown in trypticase soy broth and diluted so that 0.03 mL of a concentrated suspension could be instilled intranasally into the mice by placing fluid over the nares (Culbertson et al., 1966; Culbertson, Ensminger, & Overton, 1965a; Culbertson, Ensminger, & Overton, 1965b).

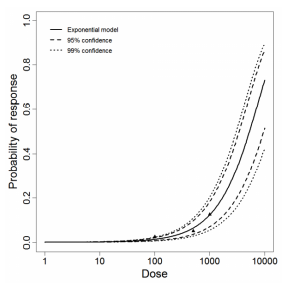
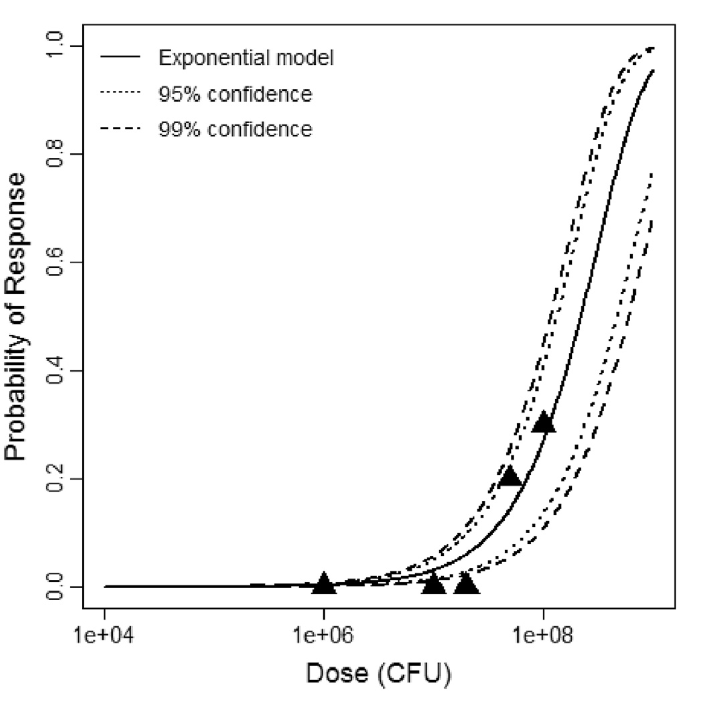
The exponential model provided the best fit to the data. 


Figure 1. Parameter histogram for exponential model (uncertainty of the parameter)
Figure 2. Exponential model plot, with confidence bounds around optimized model

Culbertson, C. G., Holmes, D. H., & Overton, W. M. (1965b). Hartmanella castellani (Acanthamoeba sp.). The American Journal of Clinical Pathology, 43(4), 361–364.

Culbertson, C. G., Ensminger, P. W., & Overton, W. M. (1966). Hartmannella (Acanthamoeba): Experimental Chronic, Granulomatous Brain Infections Produced by New Isolates of Low Virulence. The American Journal of Clinical Pathology, 46(3), 305–314.

# of Doses
3.00
Μodel
LD50/ID50
5.28E+03
Dose Units
Response
Exposure Route
Contains Preferred Model
Status
fitted
k
1.31E-04
Agent Strain
A. castellanii HN-3
Experiment ID
Acanth_Intranasal2
Host type
Experiment Dataset
Dose (no. of organsims) Positive Responses Negative Responses Total Subjects/Responses
100 2 78 80
500 4 76 80
1000 10 70 80
Description
Mice/Naegleria fowleri LEE strain data
Dose Dead Survived Total
1E+02 0 10 10
1E+02 0 10 10
1E+02 0 10 10
1E+03 0 10 10
1E+03 1 9 10
1E+03 1 9 10
1E+04 1 9 10
1E+04 4 6 10
1E+04 4 6 10
1E+05 4 6 10
1E+05 6 4 10
1E+05 7 3 10
1E+06 7 3 10


Goodness of fit for pooled data
Model Deviance Degrees 
of freedom

χ20.95,1


χ20.95,m-k 
 
Beta Poisson 7.4 11 19.68 0.77
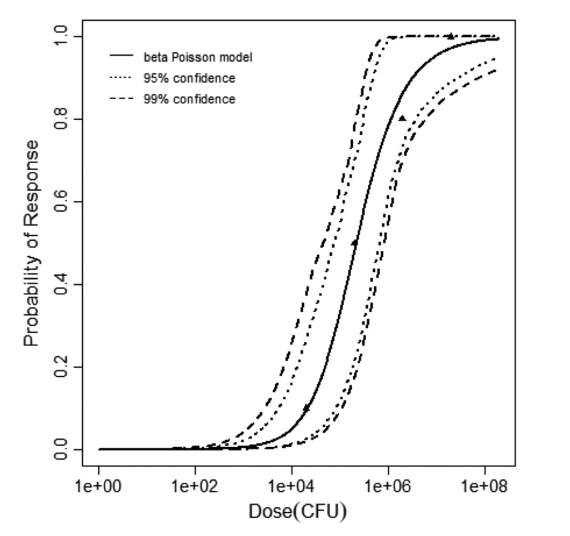
Plot of beta-Poisson model for pooled data of CD1 mice swimming for 5, 10, and 20 minutes with upper and lower 95% and 99% confidence.
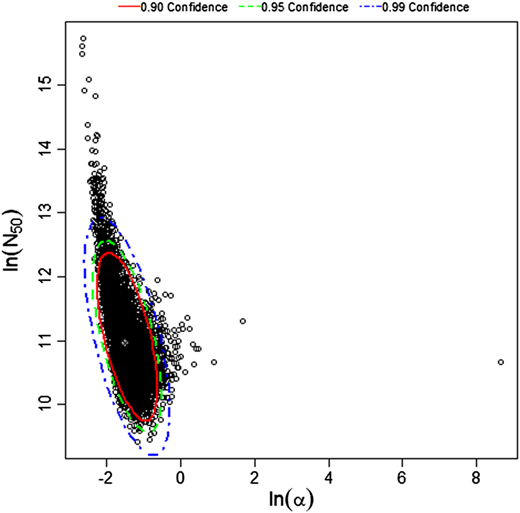
Bootstrapped distribution of beta-Poisson parameter estimates for pooled data of CD1 mice swimming for 5, 10, and 20 minutes; the center marker (X) represents the maximum likelihood estimate.


Host
CD1 Mice
# of Doses
13.00
Μodel
N50
5.79E+04
LD50/ID50
5.79E+04
Dose Units
Response
Contains Preferred Model
Status
pooled
a
0.226
Experiment ID
954,955,956,957
Experiment Dataset
Description
Mice/Naegleria fowleri LEE strain data
Dose Dead Survived Total
1E+02 0 10 10
1E+03 1 9 10
1E+04 4 6 10
1E+05 7 3 10


Goodness of fit and model selection
Model Deviance Δ Degrees 
of freedom

χ20.95,1


χ20.95,m-k 
 
Exponential 6.13 5.90 3 3.84 7.81
Beta Poisson 0.23 2 5.99
Beta-Poisson is preferred to Exponential;
Naegleria fowleri infection acquired by mice through swimming in amebae-contaminated water
Host
CD1 Mice
# of Doses
4.00
Μodel
N50
1.98E+04
LD50/ID50
1.98E+04
Dose Units
Response
Exposure Route
Contains Preferred Model
Status
fitted
a
0.35
Agent Strain
LEE
Experiment ID
957
Experiment Dataset
Description
Mice/Naegleria fowleri LEE strain data
Dose Dead Survived Total
1E+02 0 10 10
1E+03 1 9 10
1E+04 4 6 10
1E+05 6 4 10


Goodness of fit and model selection
Model Deviance Δ Degrees 
of freedom

χ20.95,1


χ20.95,m-k 
 
Exponential 7.89 7.55 3 3.84 7.81
Beta Poisson 0.33 2 5.99
Beta-Poisson is preferred to Exponential;


Beta-Poisson model plot, with confidence bounds around optimized model


Host
CD1 Mice
# of Doses
4.00
Μodel
N50
3.05E+04
LD50/ID50
3.05E+04
Dose Units
Response
Exposure Route
Contains Preferred Model
Status
fitted
a
0.241
Agent Strain
LEE
Experiment ID
956
Experiment Dataset
Description
Mice/Naegleria fowleri LEE strain data
Dose Dead Survived Total
1E+02 0 10 10
1E+03 0 10 10
1E+04 1 9 10
1E+05 4 6 10
1E+05 7 3 10


Goodness of fit and model selection
Model Deviance Δ Degrees 
of freedom

χ20.95,1


χ20.95,m-k 
 
Exponential 6.13 5.88 4 3.84  9.49
Beta Poisson 0.25 3  7.81
Beta-Poisson is preferred to Exponential;
 Beta-Poisson model plot with confidence bounds around optimized model
Beta-Poisson model plot with confidence bounds around optimized model
Host
CD1 Mice
# of Doses
5.00
Μodel
N50
1.99E+05
LD50/ID50
1.99E+05
Dose Units
Response
Exposure Route
Contains Preferred Model
Status
fitted
a
0.353
Agent Strain
LEE
Experiment ID
955
Experiment Dataset
Description
Mice/Naegleria fowleri LEE strain data
Dose Dead Survived Total
1E+03 7 3 10
1E+04 8 2 10
1E+05 10 0 10
1E+06 10 0 10


Goodness of fit and model selection
Model Deviance Δ Degrees 
of freedom

χ20.95,1


χ20.95,m-k 
 
Exponential 11.28 9.64 3 3.84 7.81 
0.325
Beta Poisson 1.64 2 5.99 
0.177
Beta-Poisson is preferred to Exponential;
Beta-Poisson model plot
# of Doses
4.00
Μodel
N50
422
LD50/ID50
422
Dose Units
Response
Exposure Route
Contains Preferred Model
Status
fitted
a
0.536
Experiment ID
954
Host type
Experiment Dataset
Description
myco
Host
C57BL/6 beige mice/NS
# of Doses
5.00
Μodel
LD50/ID50
2.22E+8
Dose Units
Response
Exposure Route
Contains Preferred Model
Status
fitted
k
3.12E-9
Agent Strain
MAC 101 (human-derived)
Experiment ID
myco_intravenous_2
Host type
Experiment Dataset
Description
Host
black-spotted and spiny frogs
# of Doses
7.00
Μodel
N50
2.37E+05 [1.06E+05, 5.49E+05], β = 86,351 [16,154, 632,550]
LD50/ID50
2.37E+05 [1.06E+05, 5.49E+05]
Dose Units
Response
Contains Preferred Model
Status
pooled
a
0.52 [0.27, 1.53]
Experiment ID
ek_ pooled
Description
Intraperitoneal2.png
Host
Balb/c Mice
# of Doses
4.00
Μodel
LD50/ID50
4.23E+08
Dose Units
Response
Exposure Route
Contains Preferred Model
Status
fitted
k
1.64E-09
Agent Strain
E. anopheles
Experiment ID
ek_ intraperitoneal2
Experiment Dataset