| ||||||||||||||||||||||
| Model | Deviance | Δ | DF | χ20.95,df | χ20.95,1 | Good fit? | Parameters | LD50 |
|---|---|---|---|---|---|---|---|---|
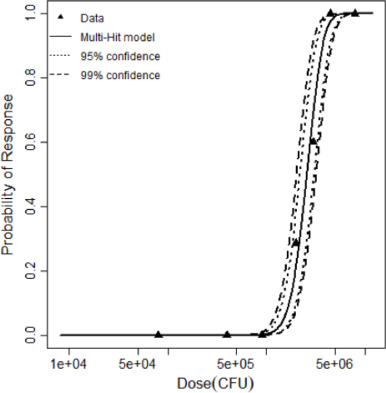
| Multi-hit | 1.09 | 15.69 | 5 | 11.1 | 3.84 | Yes | k = 4.12 × 10⁻⁶ kmin=11 | 2,588,047 |
| Dose (CFU) | Positive Response | Negative Response |
|---|---|---|
| 80000 | 0 | 10 |
| 400000 | 0 | 10 |
| 900000 | 0 | 10 |
| 2000000 | 2 | 5 |
| 3000000 | 6 | 4 |
| 4500000 | 10 | 0 |
| 8000000 | 10 | 0 |
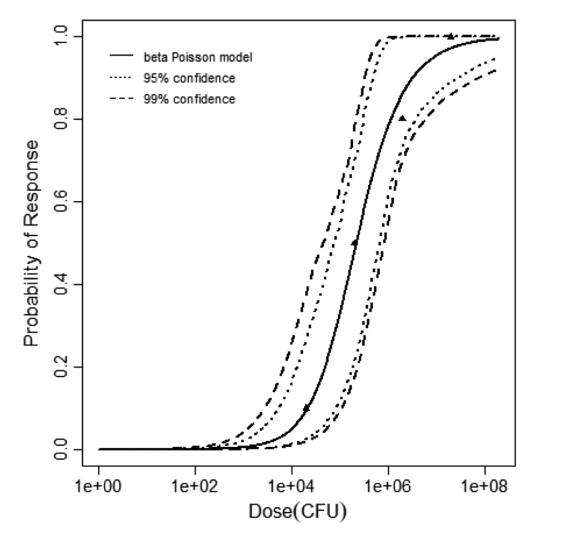
The same exposure route and endpoint was evaluated for Experiments 3 and 4 (Cerva, 1967b; Culbertson et al. 1966)[6] [5]. A pooling analysis was attempted and successful. The beta-Poisson model provided a good fit to the pooled data and is shown below in Figure 1. Note: both the exact and approximate beta-Poisson models were fit to the data. The figures shown below and the csv file of bootstrapped parameter replicates are for the best fitting parameters of the exact beta-Poisson model. The successful pooling of multiple datasets generally increases the confidence in the estimated model parameters.
[6] Cerva, L. (1967b). Intranasal, Intrapulmonary, and Intracardial Inoculation of Experimental Animals with Hartmanella castellanii. Folia Parasitologica (Praha), 14, 207–215.
[5] Culbertson, C. G., Ensminger, P. W., & Overton, W. M. (1966). Hartmannella (Acanthamoeba): Experimental Chronic, Granulomatous Brain Infections Produced by New Isolates of Low Virulence. The American Journal of Clinical Pathology, 46(3), 305–314.
|
||||||||||||||||||||||
|
||||||||||||||||||||||||||||||
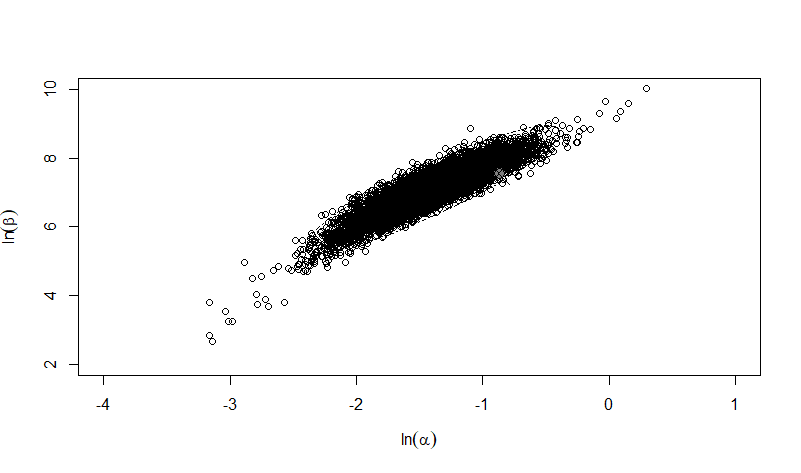
Parameter scatter plot for beta Poisson model ellipses signify the 0.9, 0.95 and 0.99 confidence of the parameters.
beta Poisson model plot, with confidence bounds around optimized model
|
|
||||||||||||||||||||||
|
||||||||||||||||||||||||||||||||||||||
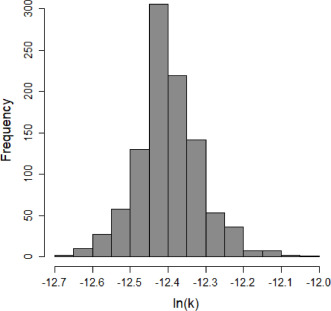
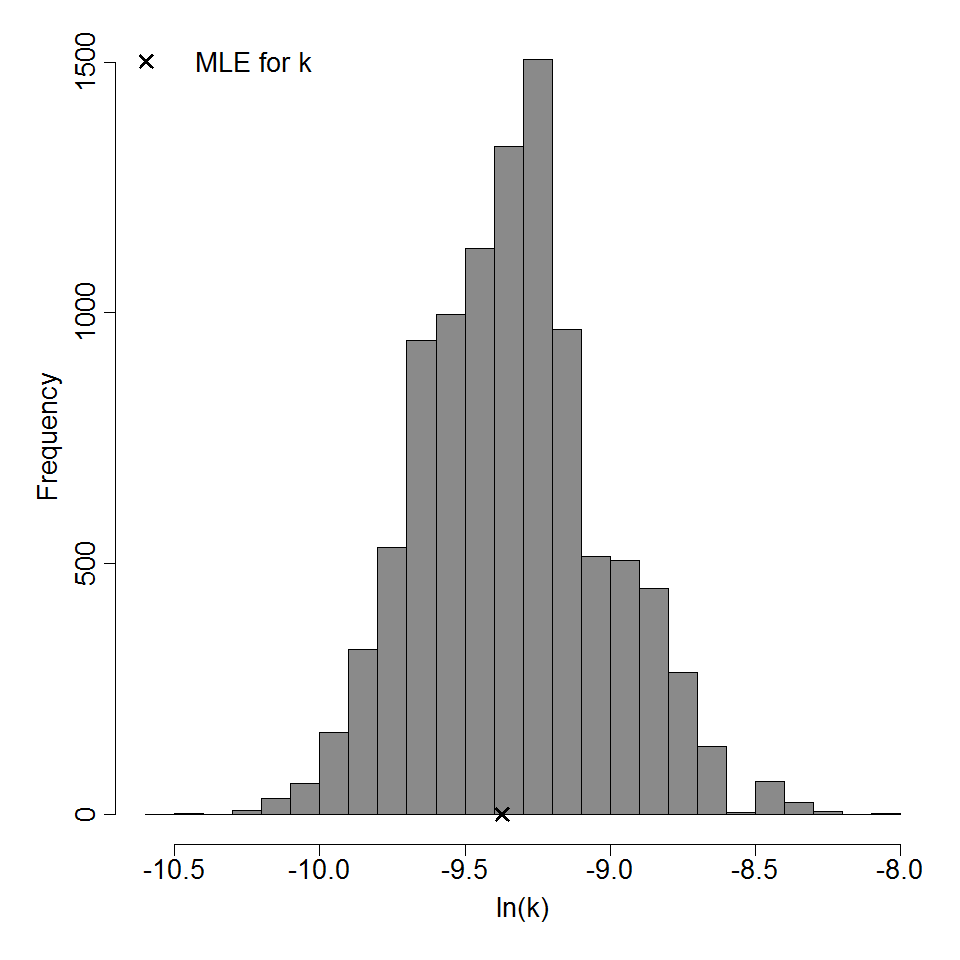
Parameter histogram for exponential model (uncertainty of the parameter)
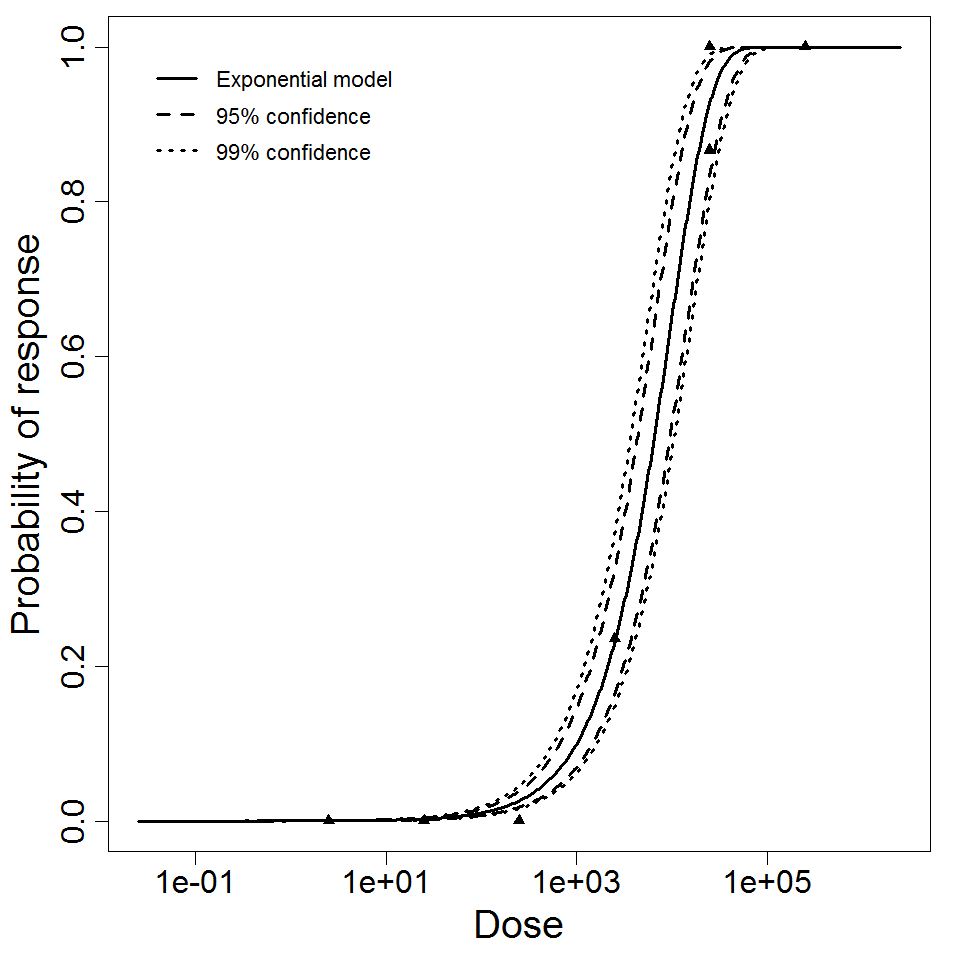
Exponential model plot, with confidence bounds around optimized model
|
|
||||||||||||||||||||||
|
||||||||||||||||||||||||||||||||||||||
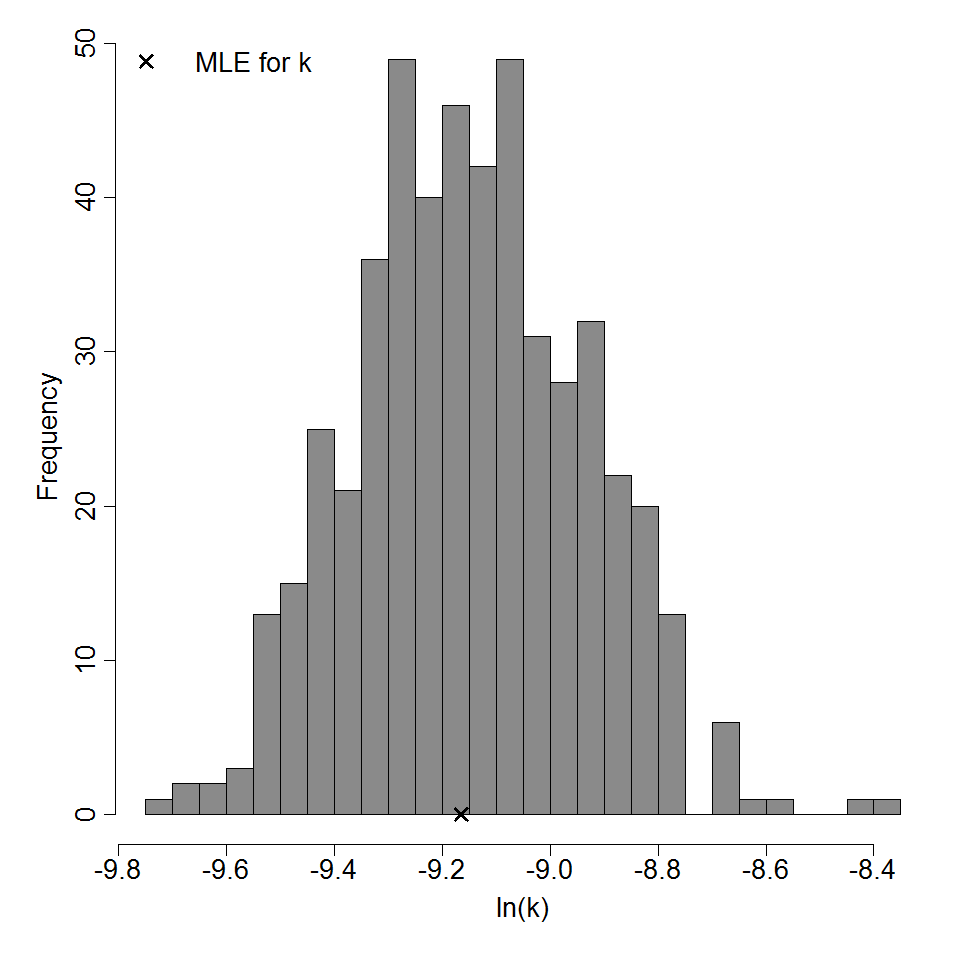
Parameter histogram for exponential model (uncertainty of the parameter)
Exponential model plot, with confidence bounds around optimized model
|
|
||||||||||||||||||||||
|
||||||||||||||||||||||||||||||||||||||

Parameter histogram for exponential model (uncertainty of the parameter)
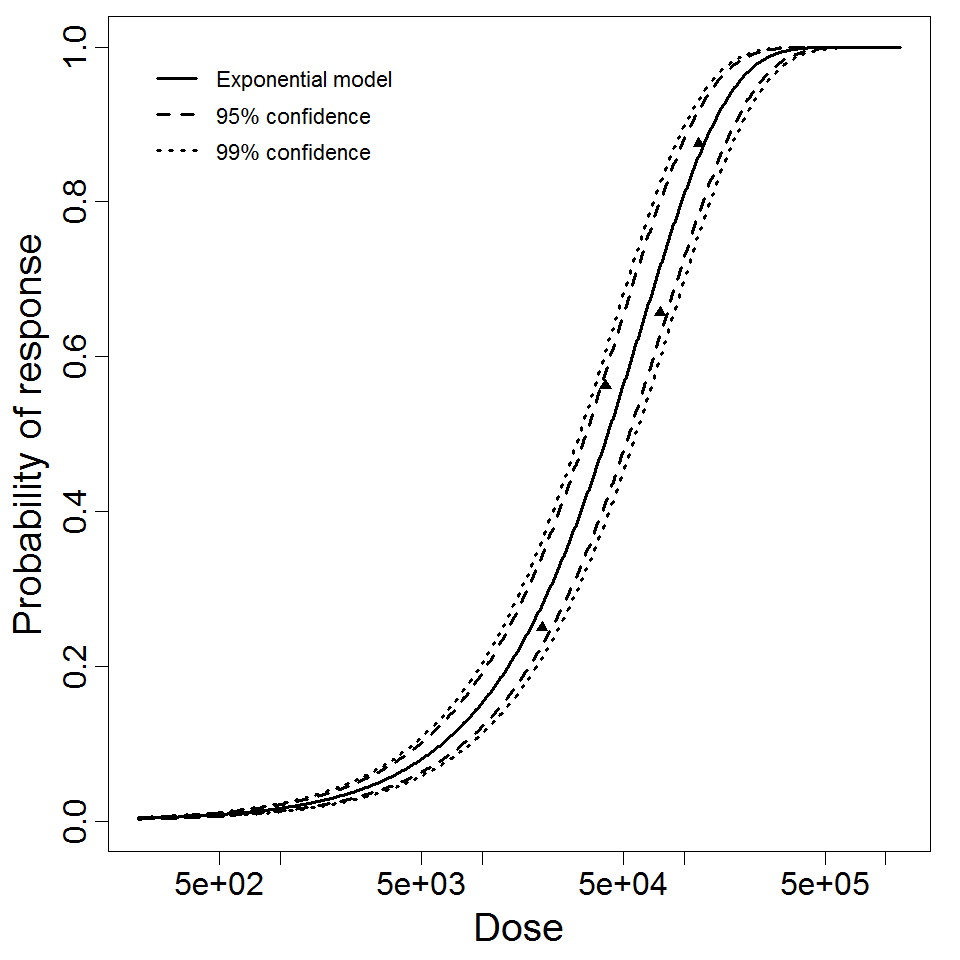
Exponential model plot, with confidence bounds around optimized model

|
|
||||||||||||||||||||||
|
||||||||||||||||||||||||||||||||||||||

Parameter histogram for exponential model (uncertainty of the parameter)
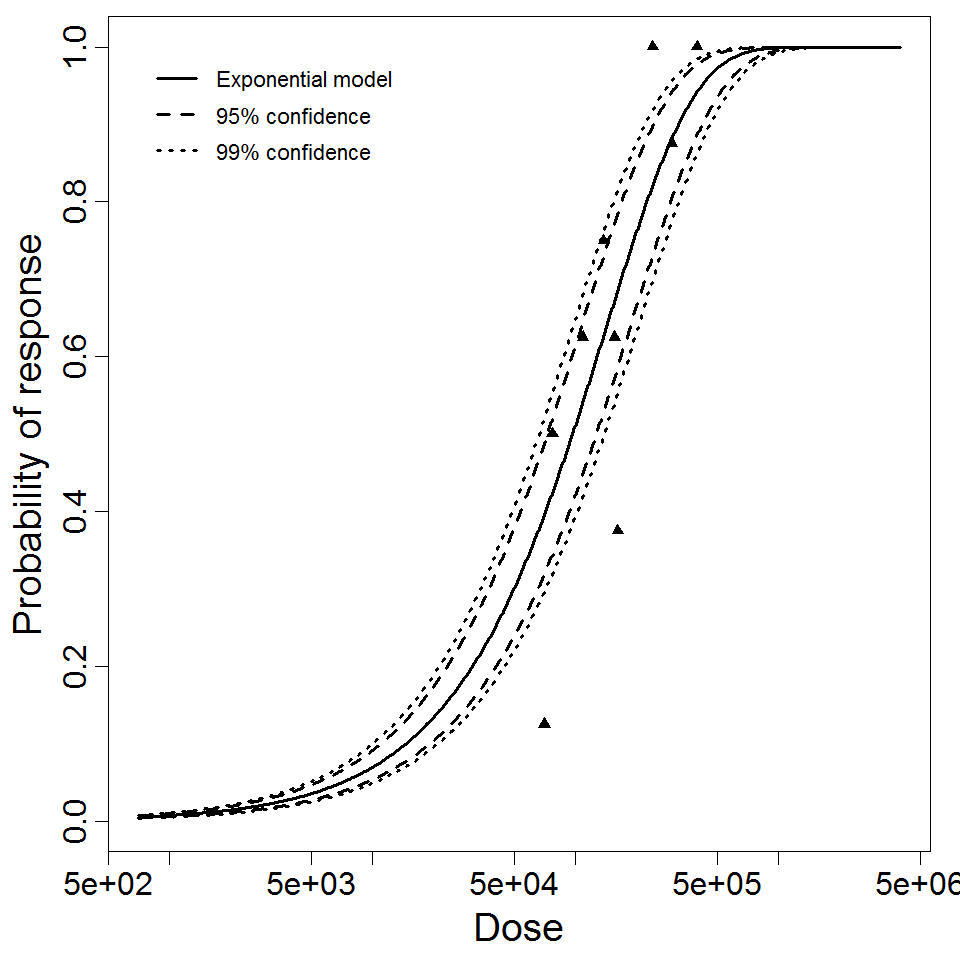
Exponential model plot, with confidence bounds around optimized model
|
|
||||||||||||||||||||||
|
||||||||||||||||||||||||||||||||||||||

Parameter histogram for exponential model (uncertainty of the parameter)
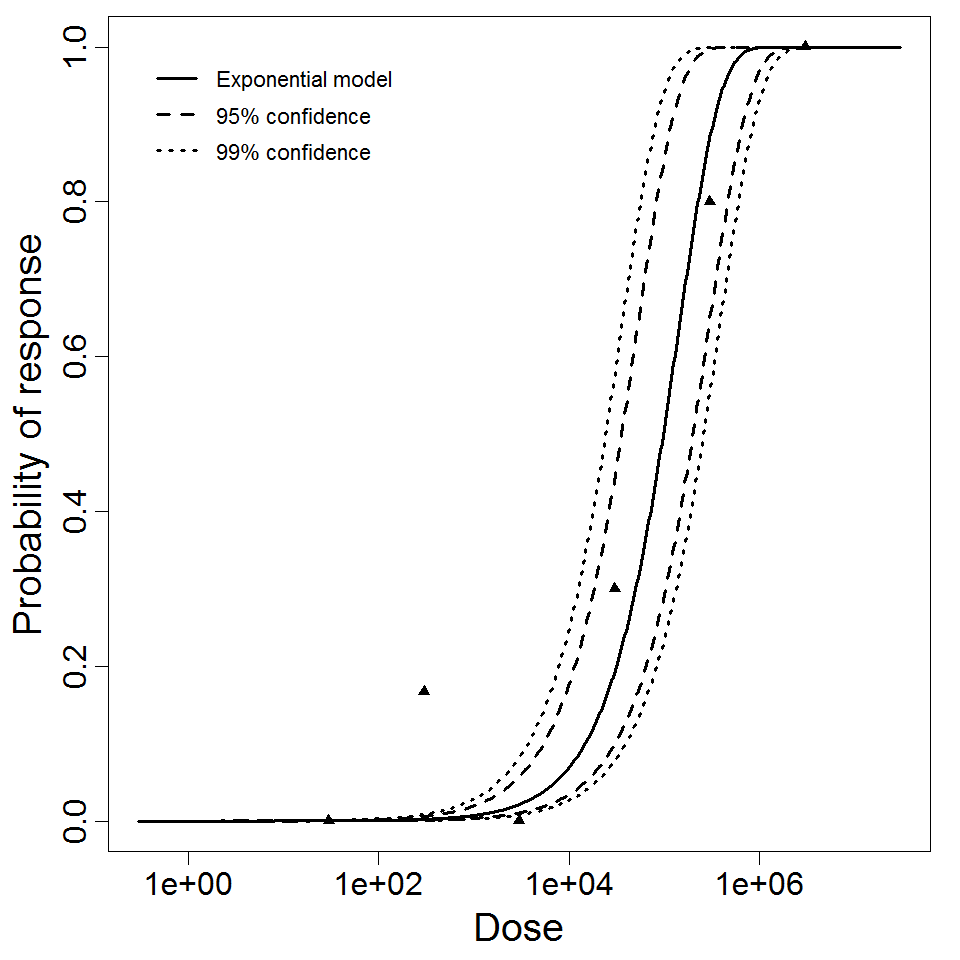
Exponential model plot, with confidence bounds around optimized model
|
|
||||||||||||||||||||||
|
||||||||||||||||||||||||||||||
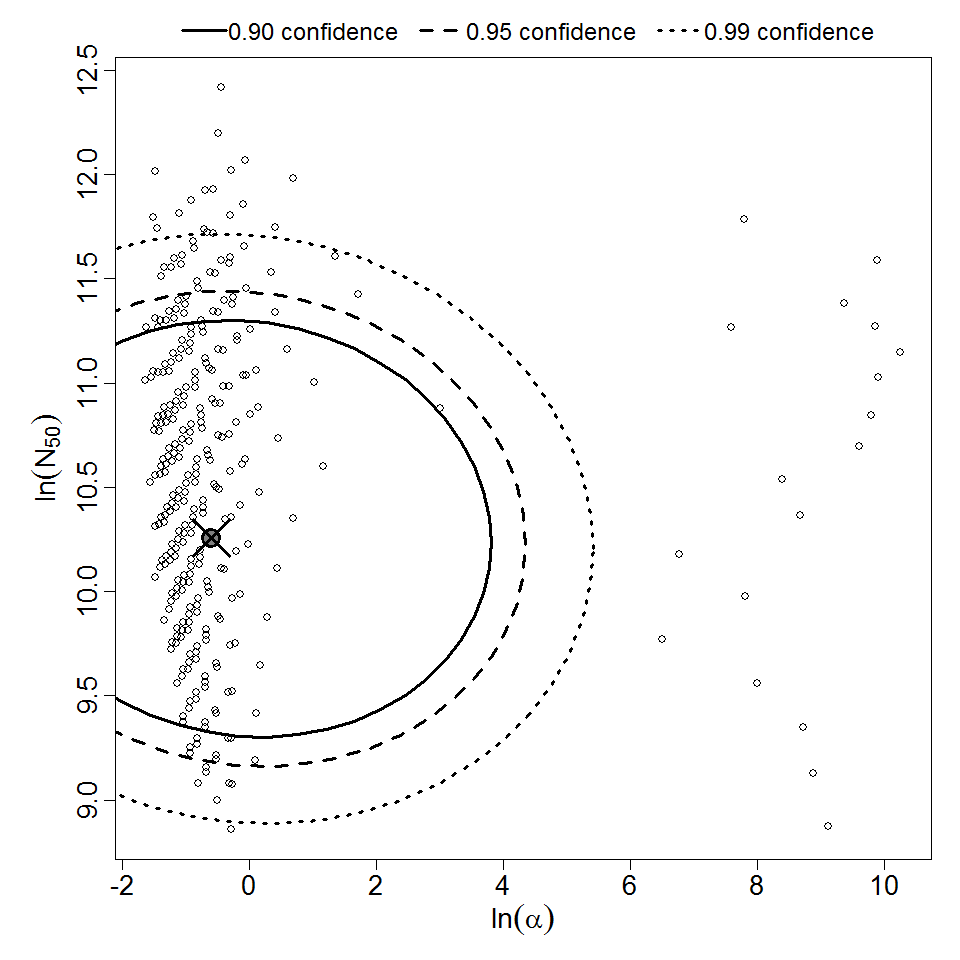
Parameter scatter plot for beta Poisson model ellipses signify the 0.9, 0.95 and 0.99 confidence of the parameters.
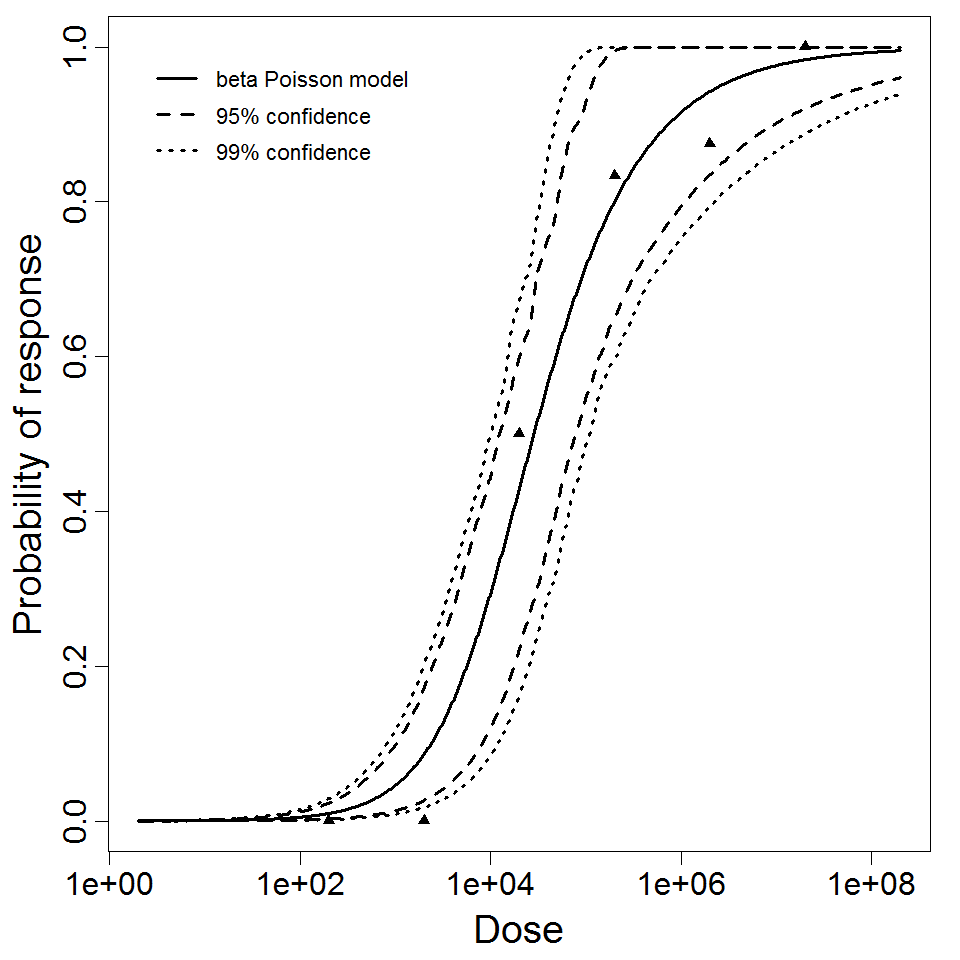
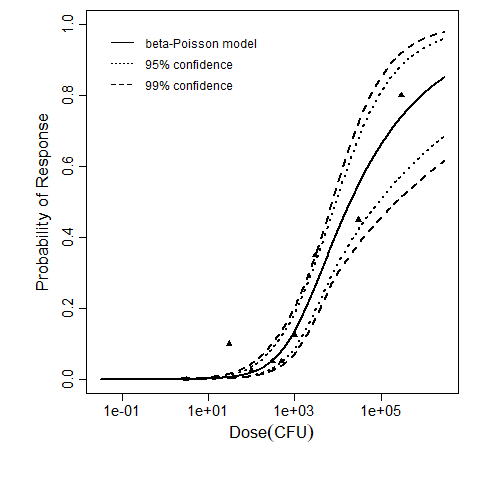
beta Poisson model plot, with confidence bounds around optimized model
Pagination
- Previous page
- Page 2
- Next page
