|
|
||||||||||||||||||||||
|
||||||||||||||||||||||||||||||
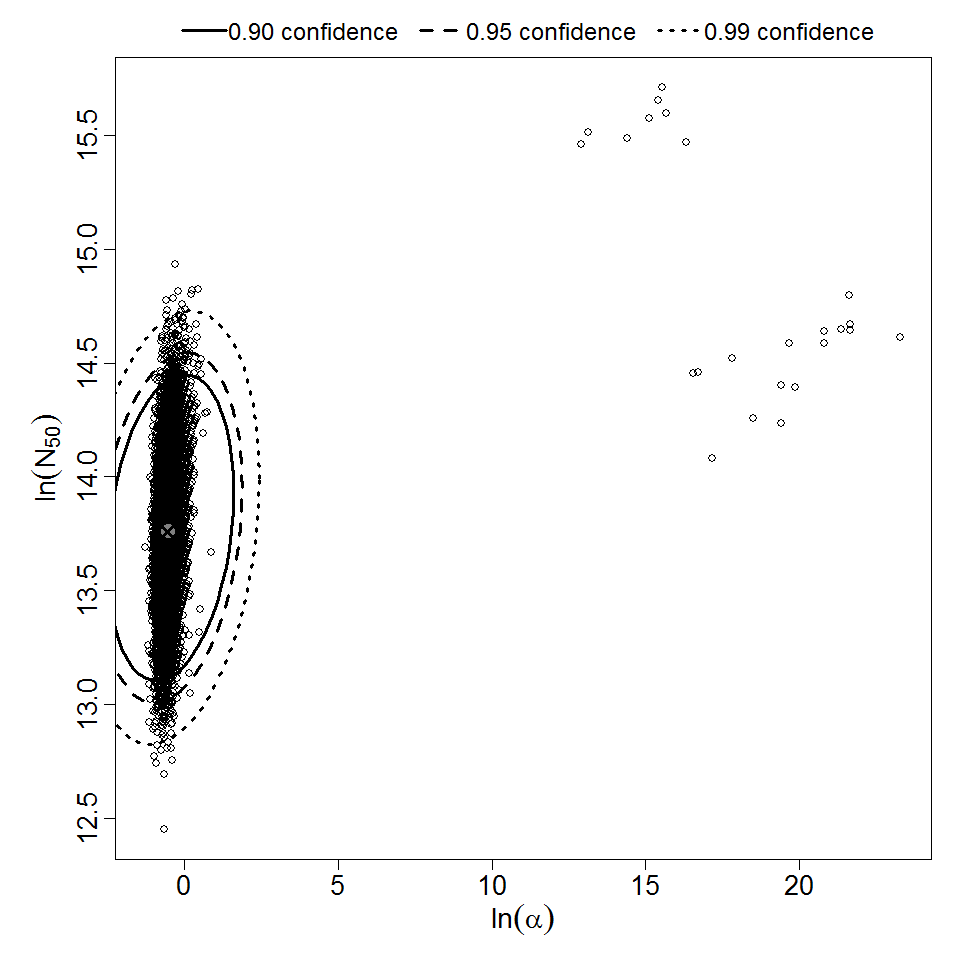
Parameter scatter plot for beta Poisson model ellipses signify the 0.9, 0.95 and 0.99 confidence of the parameters.
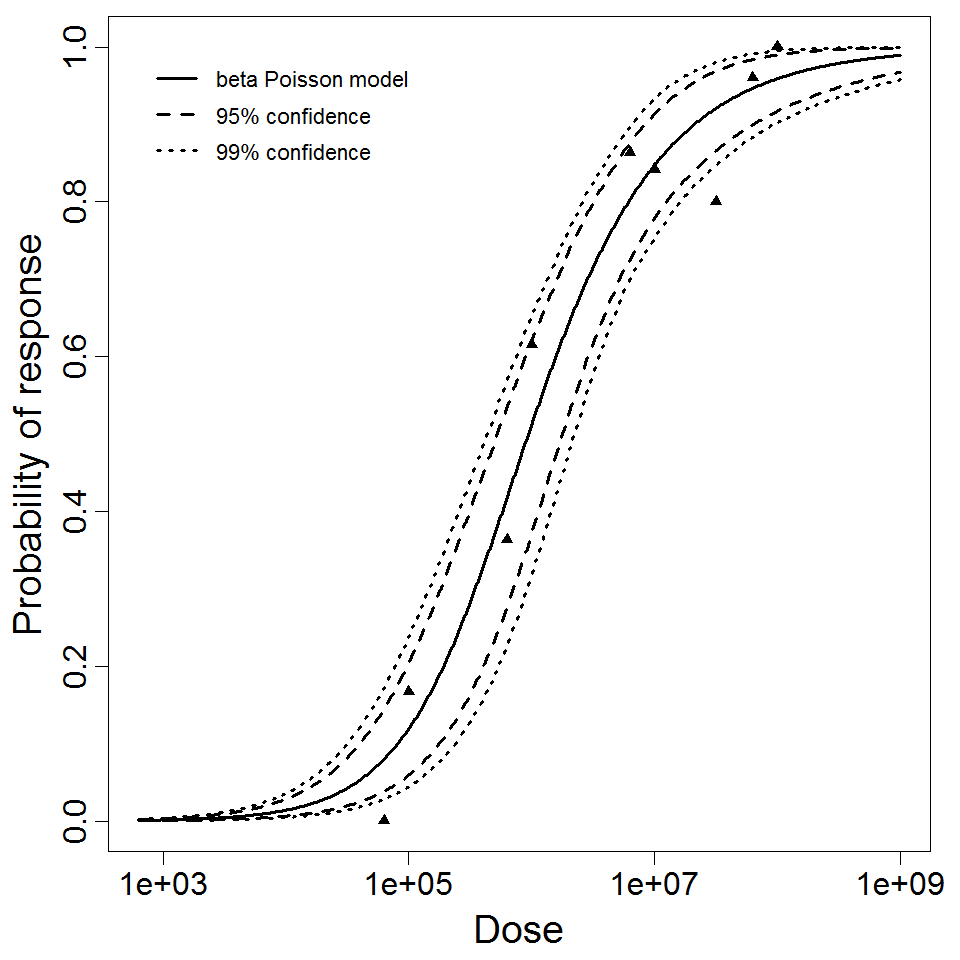
beta Poisson model plot, with confidence bounds around optimized model
|
|
||||||||||||||||||||||
|
||||||||||||||||||||||||||||||

Parameter scatter plot for beta Poisson model ellipses signify the 0.9, 0.95 and 0.99 confidence of the parameters.

beta Poisson model plot, with confidence bounds around optimized model
|
|
||||||||||||||||||||||
|
||||||||||||||||||||||||||||||||||||||
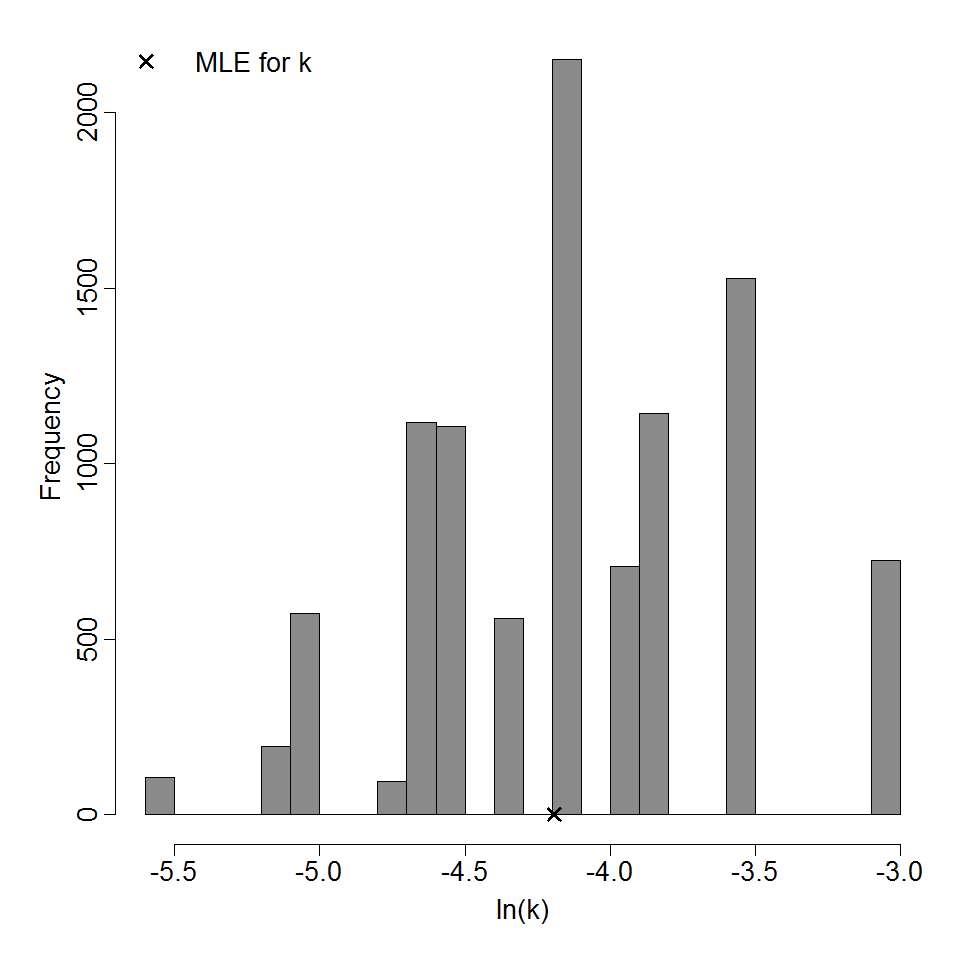
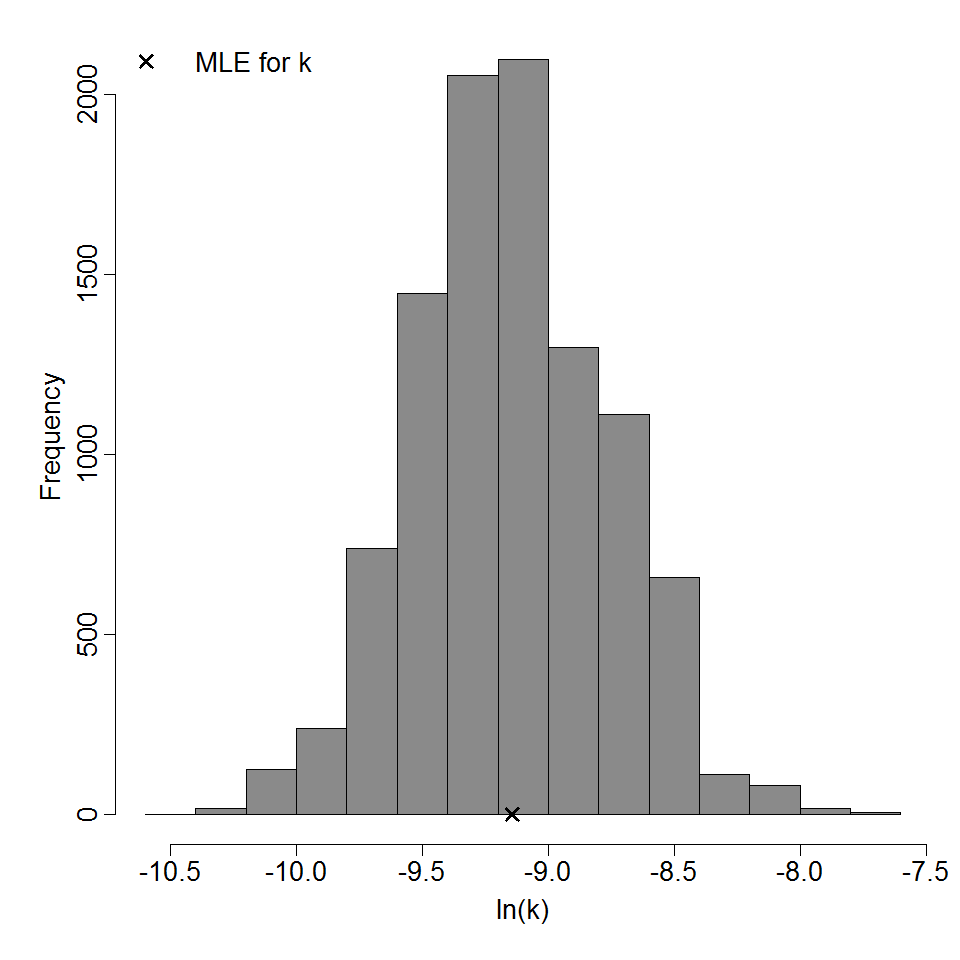
Parameter histogram for exponential model (uncertainty of the parameter)
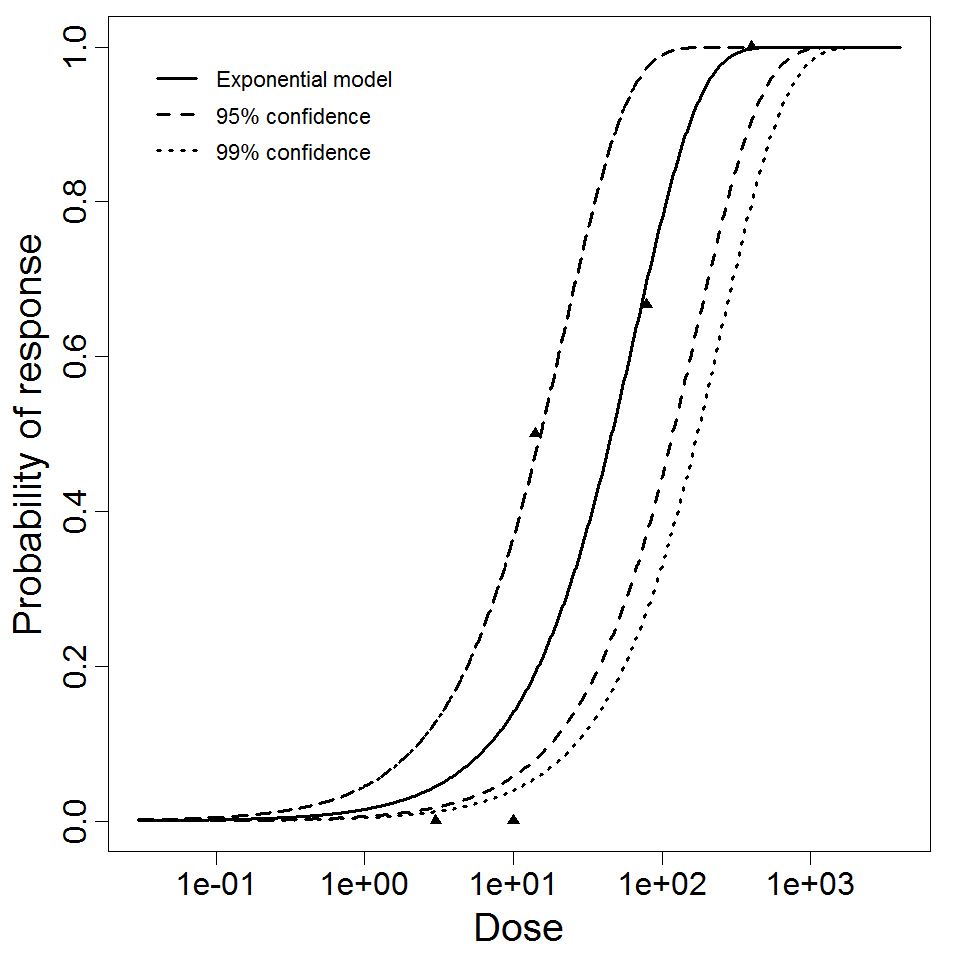
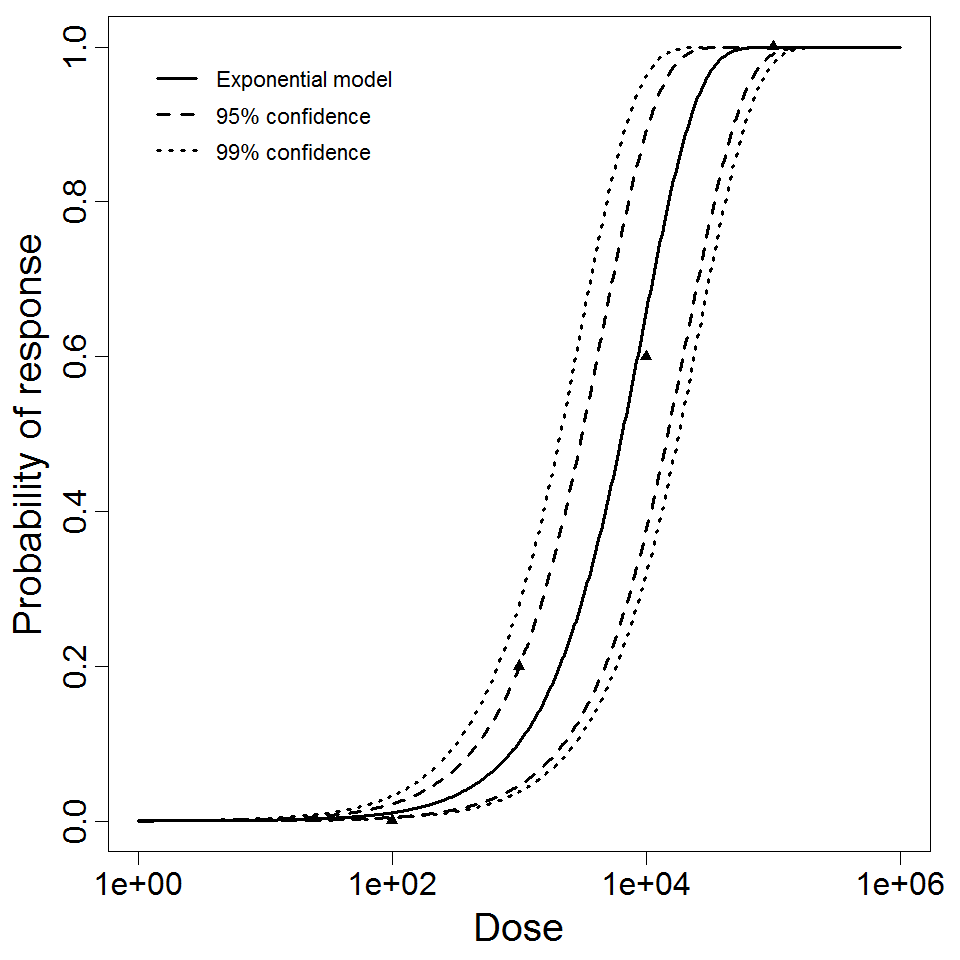
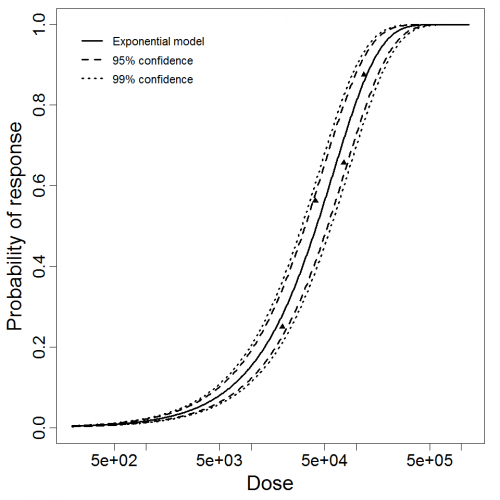
Exponential model plot, with confidence bounds around optimized model
|
|
||||||||||||||||||||||
|
||||||||||||||||||||||||||||||||||||||
Parameter histogram for exponential model (uncertainty of the parameter)
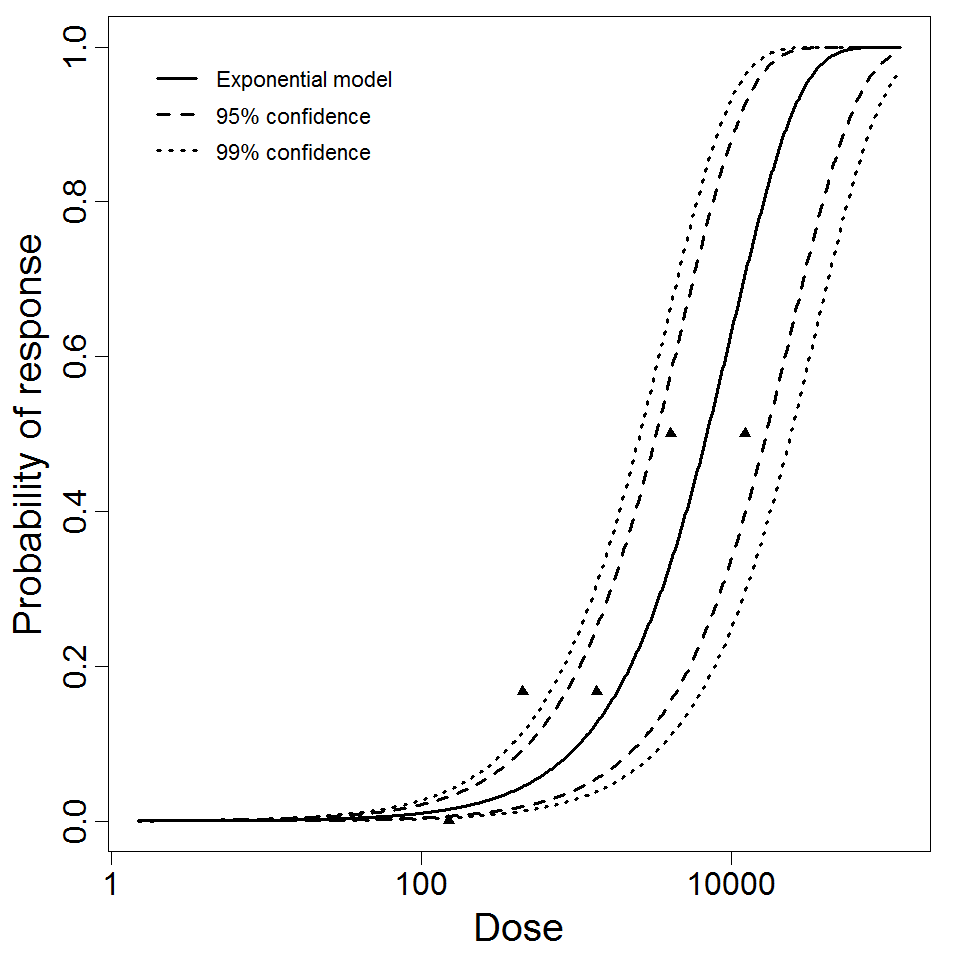
Exponential model plot, with confidence bounds around optimized model
|
| ||||||||||||||||||||||
| ||||||||||||||||||||||||||||||||||||||

|
| ||||||||||||||||||||||
| ||||||||||||||||||||||||||||||||||||||
|
| ||||||||||||||||||||||
| ||||||||||||||||||||||||||||||||||||||
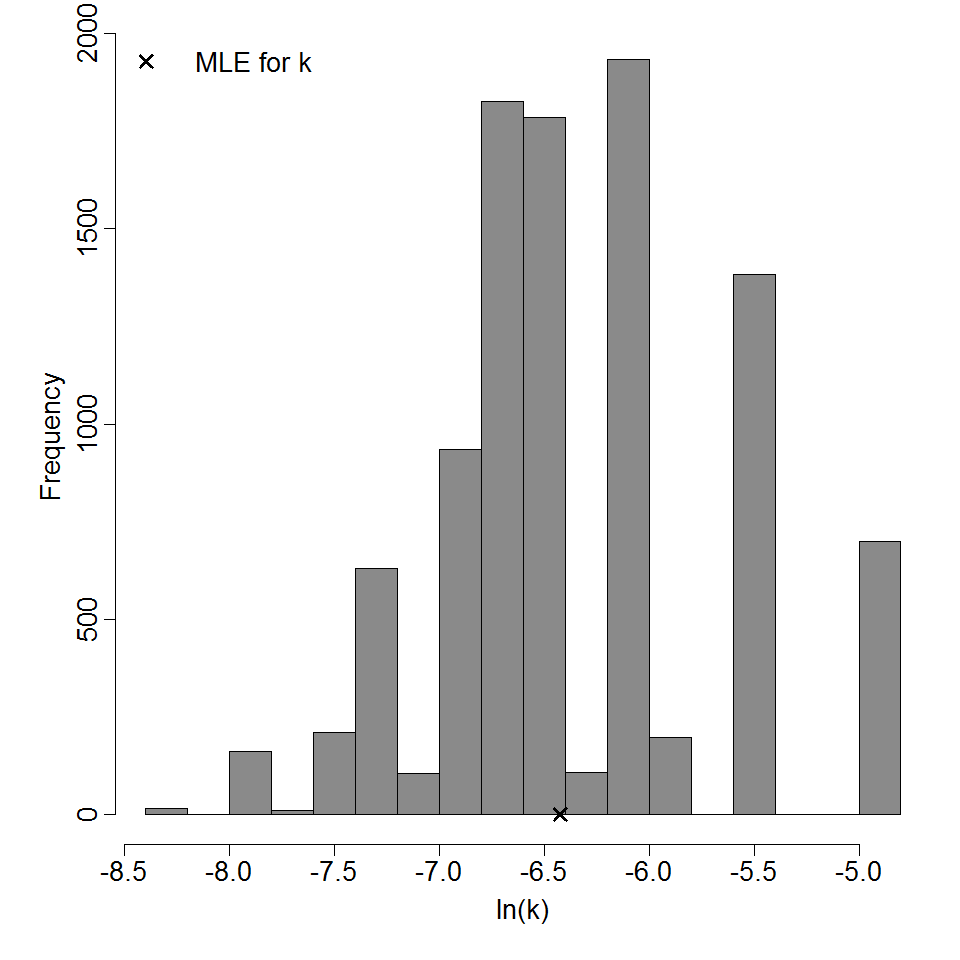
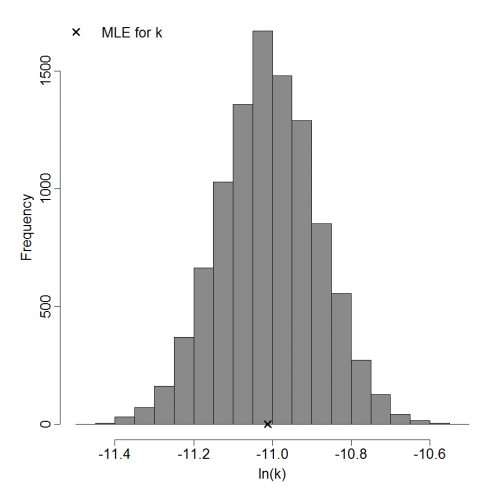
Parameter histogram for exponential model (uncertainty of the parameter)
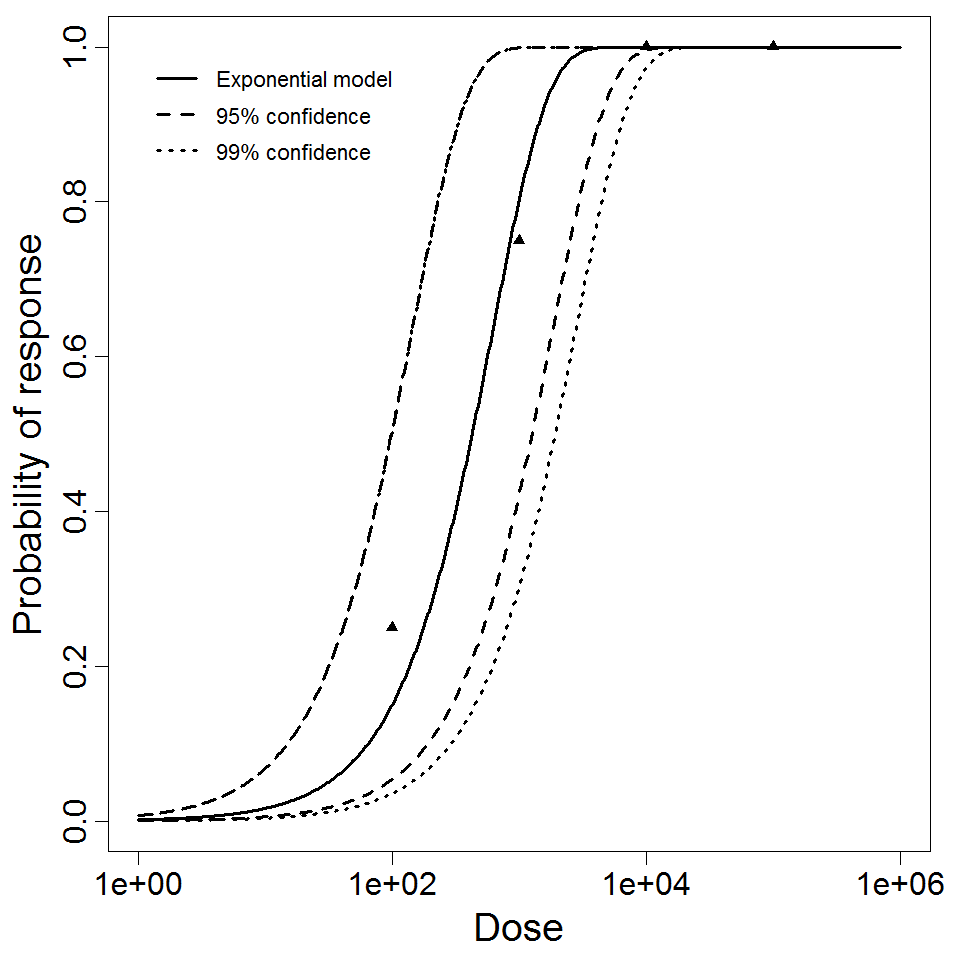
Exponential model plot, with confidence bounds around optimized model
| Dose | Dead | Survived | Total |
|---|---|---|---|
| 100 | 1 | 3 | 4 |
| 1000 | 3 | 1 | 4 |
| 1E+04 | 4 | 0 | 4 |
| 1E+05 | 4 | 0 | 4 |