$$P(response)=1-[1+dose\frac{2^{\frac{1}{a}}-1}{N^{50}} ]^{-a}$$
Description
|
|
||||||||||||||||||||||
|
||||||||||||||||||||||||||||||
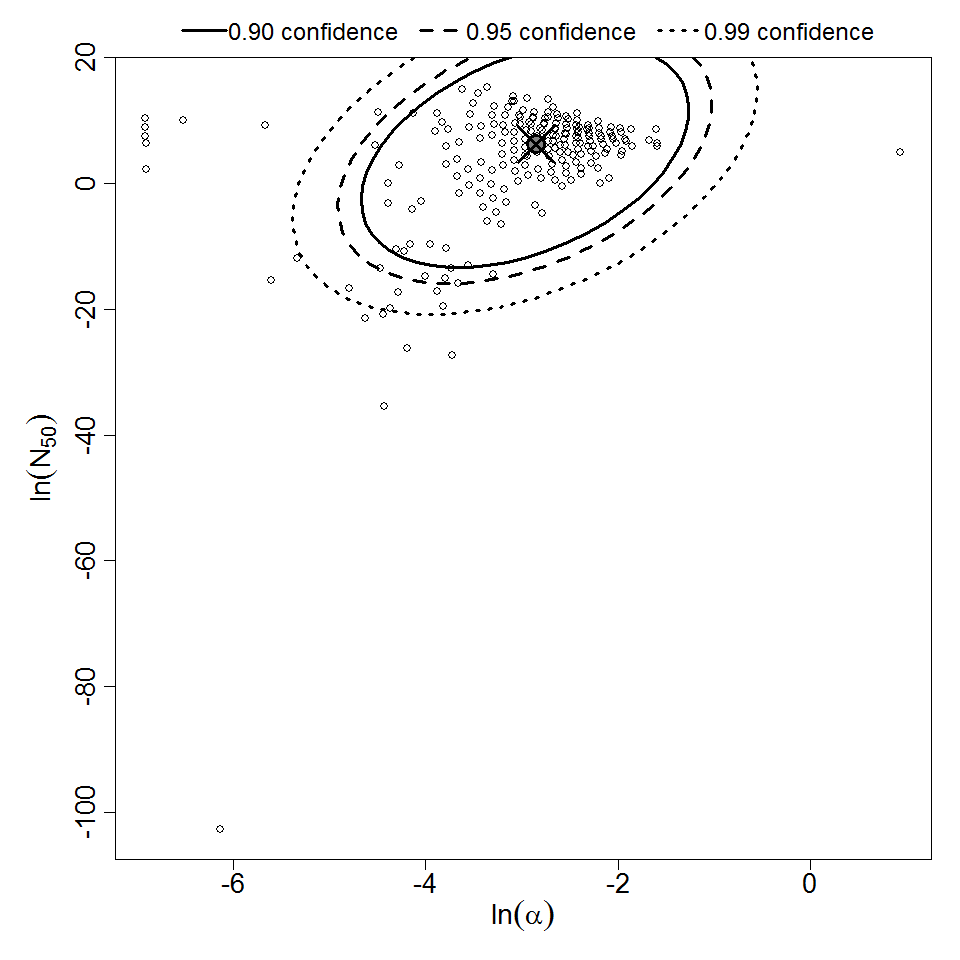
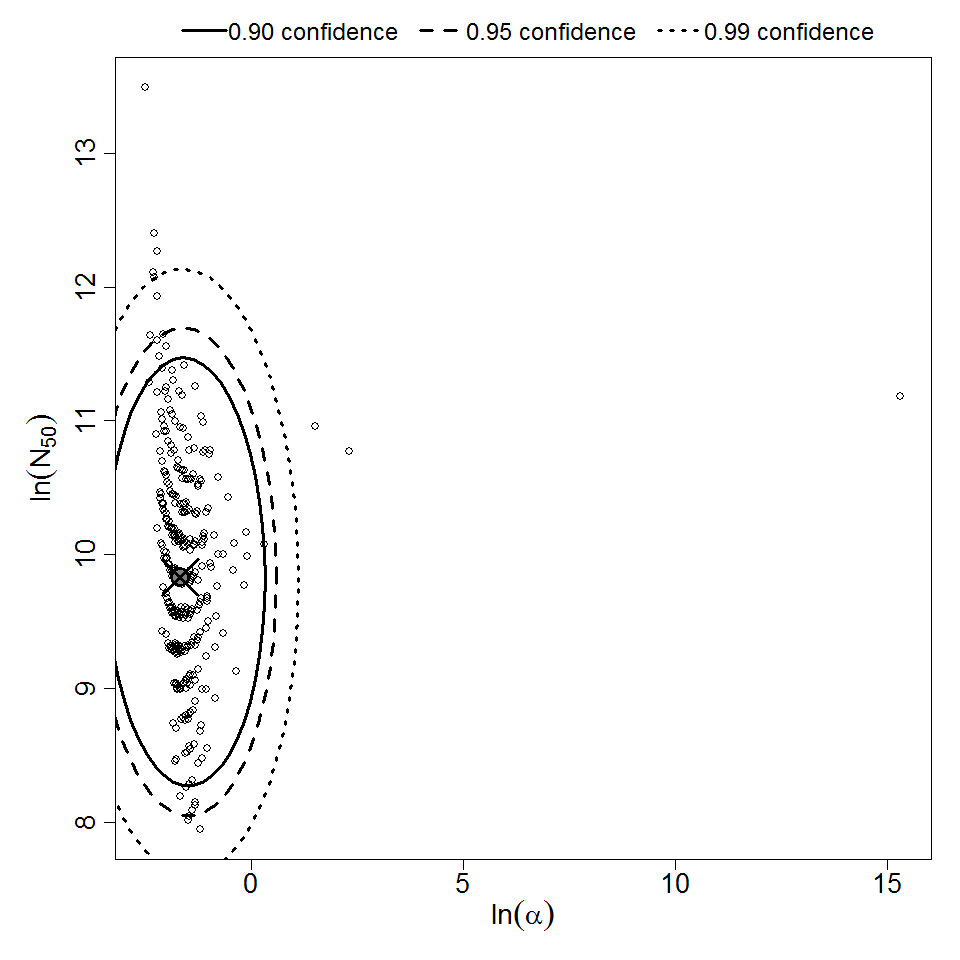
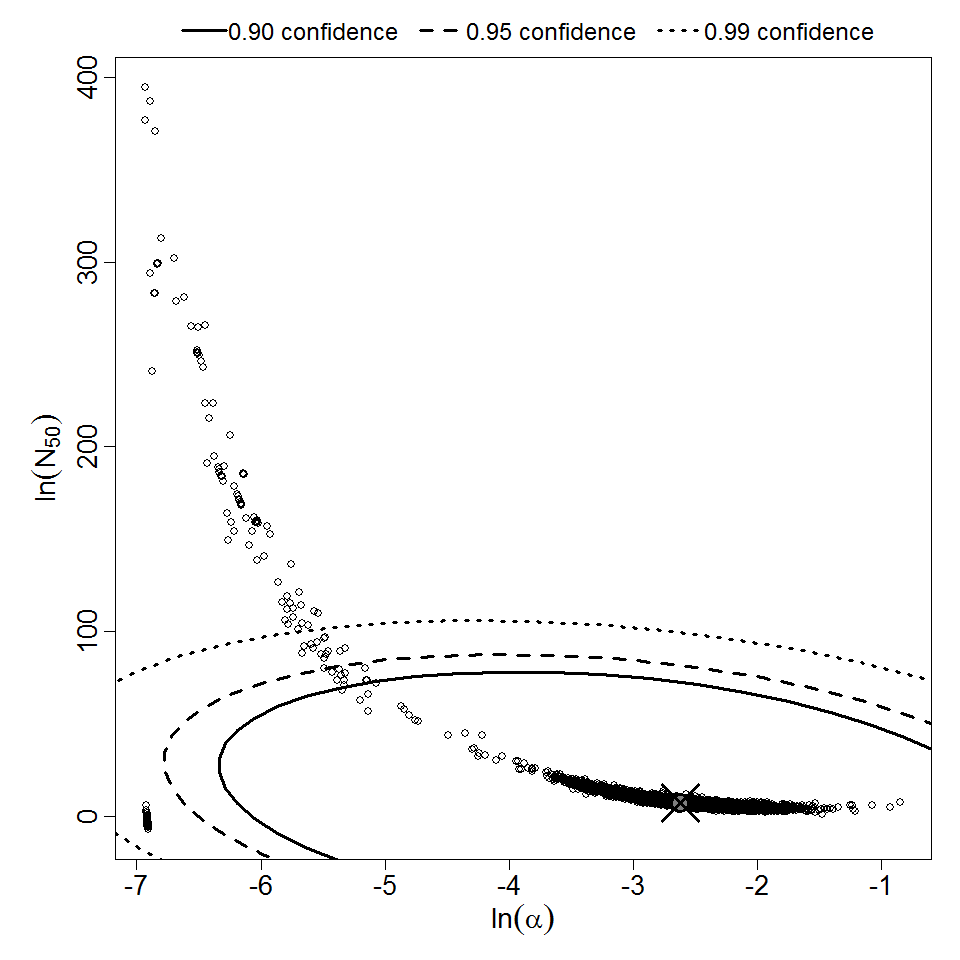
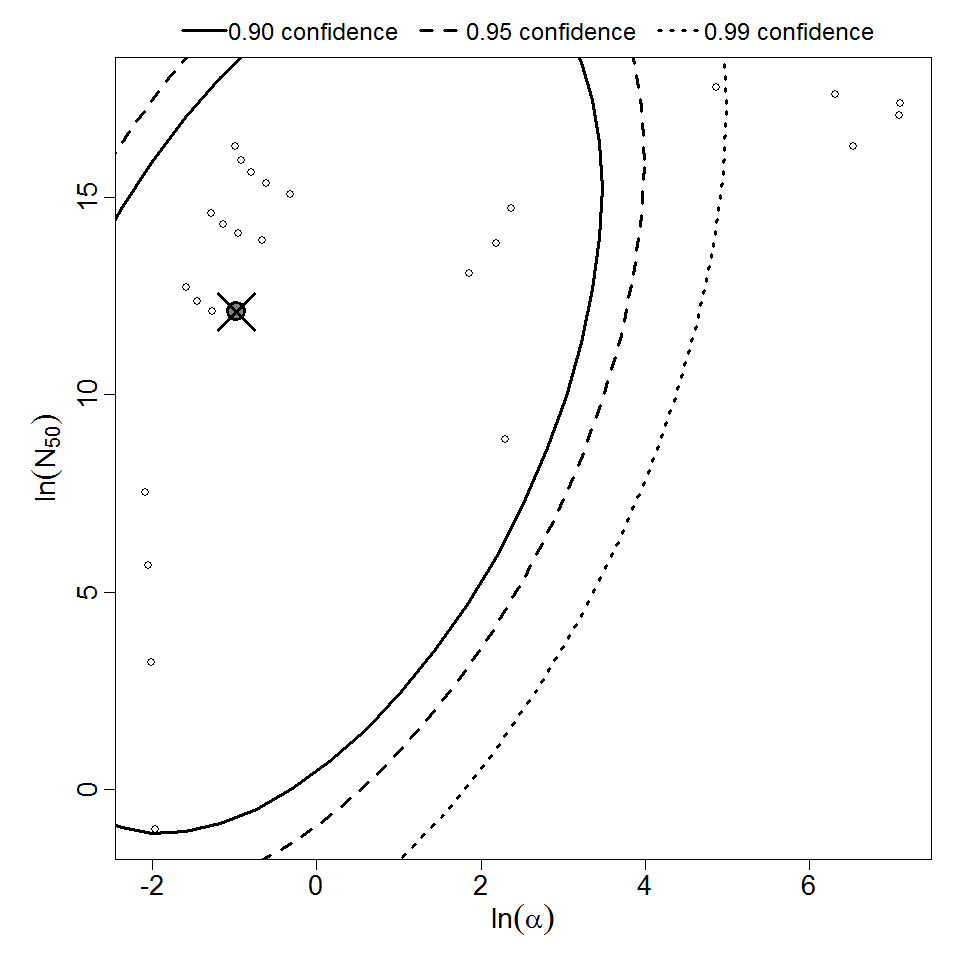
Parameter scatter plot for beta Poisson model ellipses signify the 0.9, 0.95 and 0.99 confidence of the parameters.

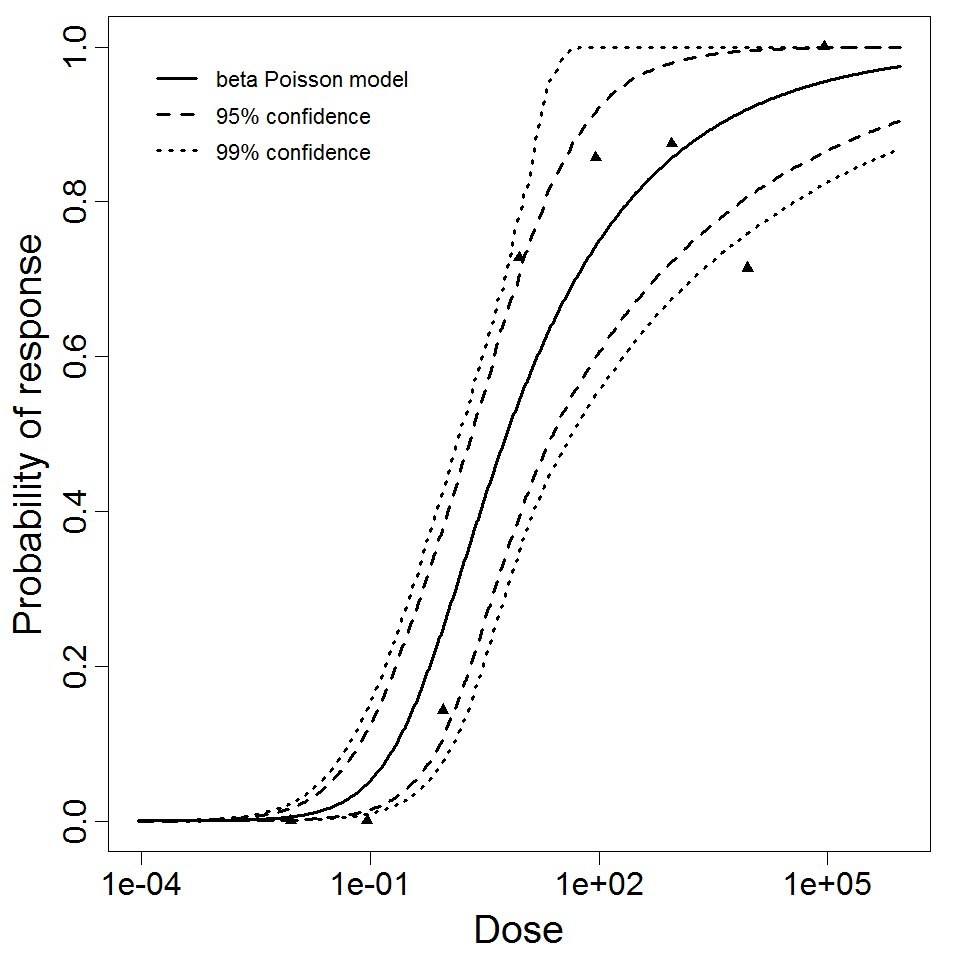
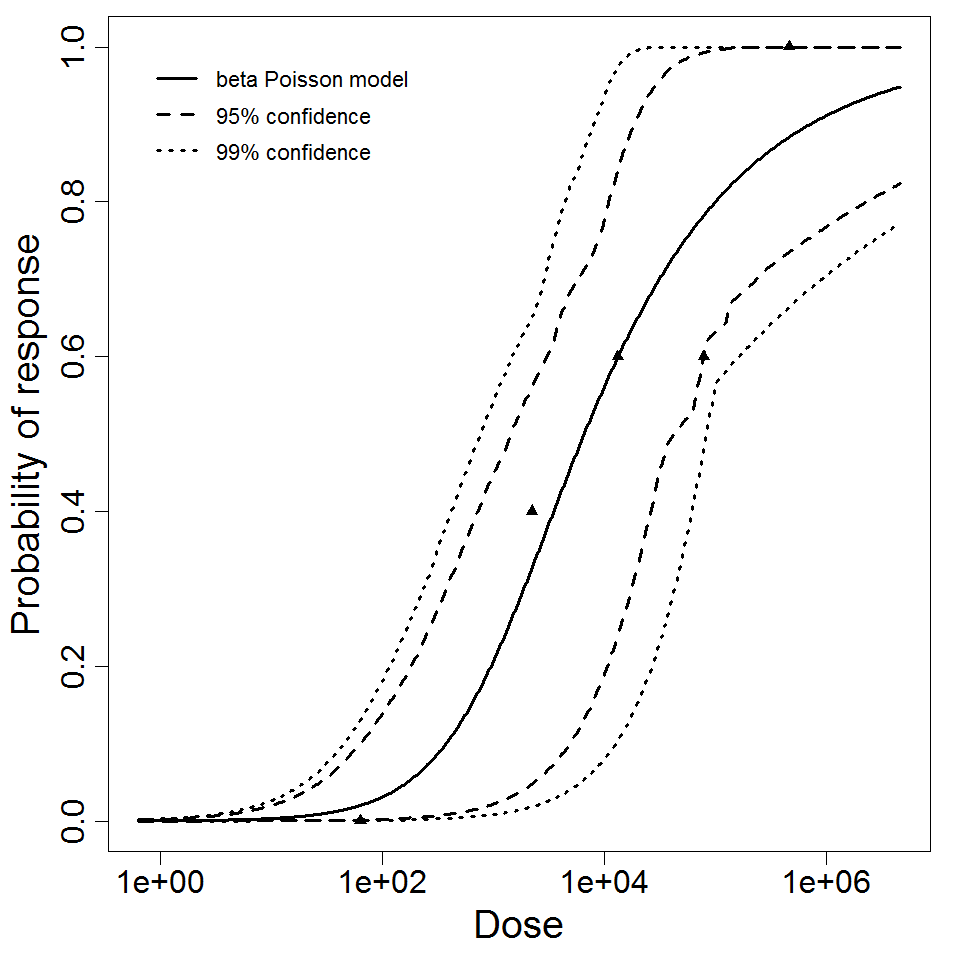
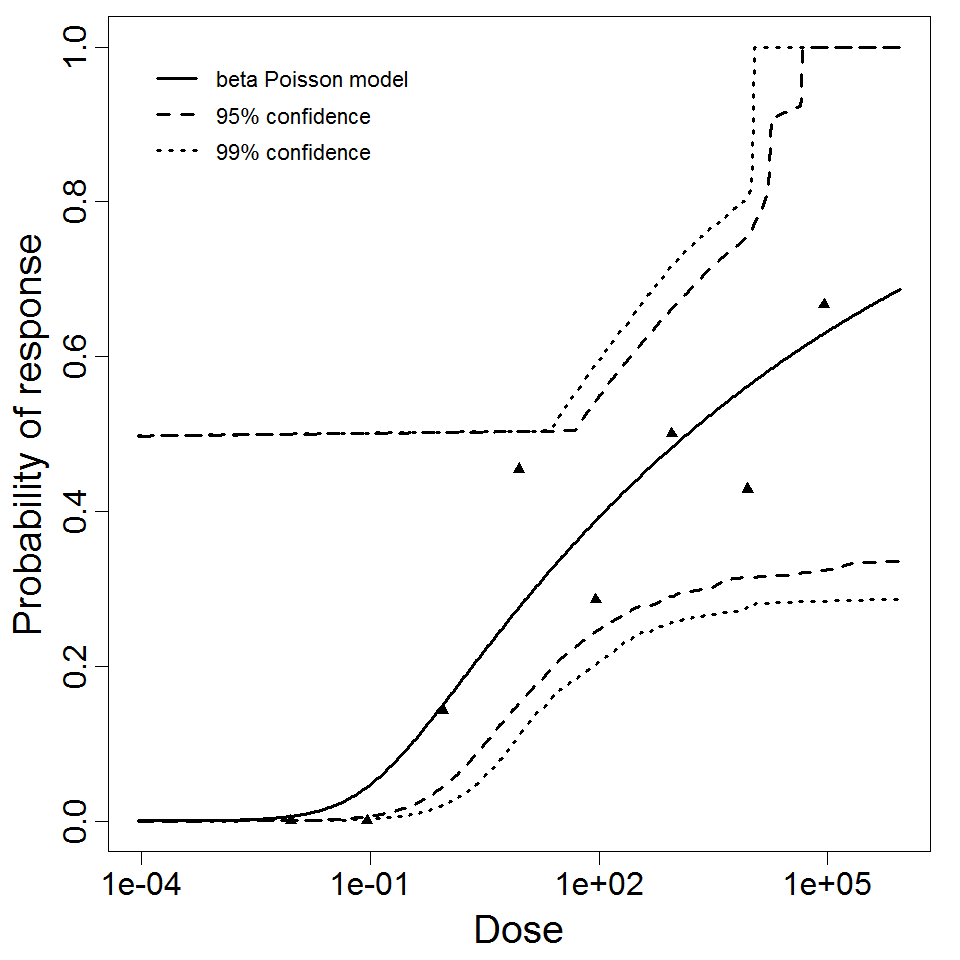
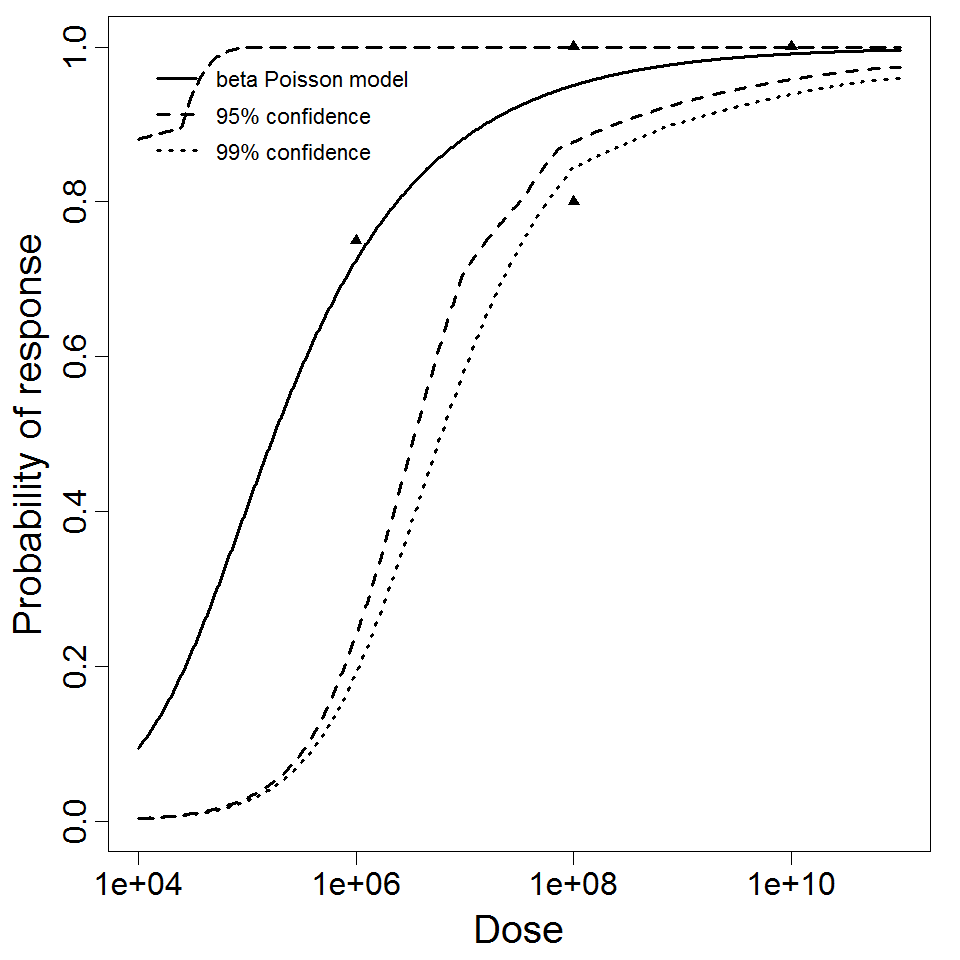
beta Poisson model plot, with confidence bounds around optimized model
# of Doses
6.00
Μodel
N50
1.93E+04
LD50/ID50
1.93E+04
Dose Units
Response
Exposure Route
Contains Preferred Model
a
6.73E-01
Agent Strain
ATCC 19660
Experiment ID
283
Host type
Description
|
| ||||||||||||||||||||||
| ||||||||||||||||||||||||||||||

# of Doses
8.00
Μodel
LD50/ID50
6.17E+00
Dose Units
Exposure Route
Contains Preferred Model
a
2.53E-02
k
6.17E+00
Experiment ID
70
Host type
Experiment Dataset
Description
|
|
||||||||||||||||||||||
|
||||||||||||||||||||||||||||||
Parameter histogram for exponential model (uncertainty of the parameter)
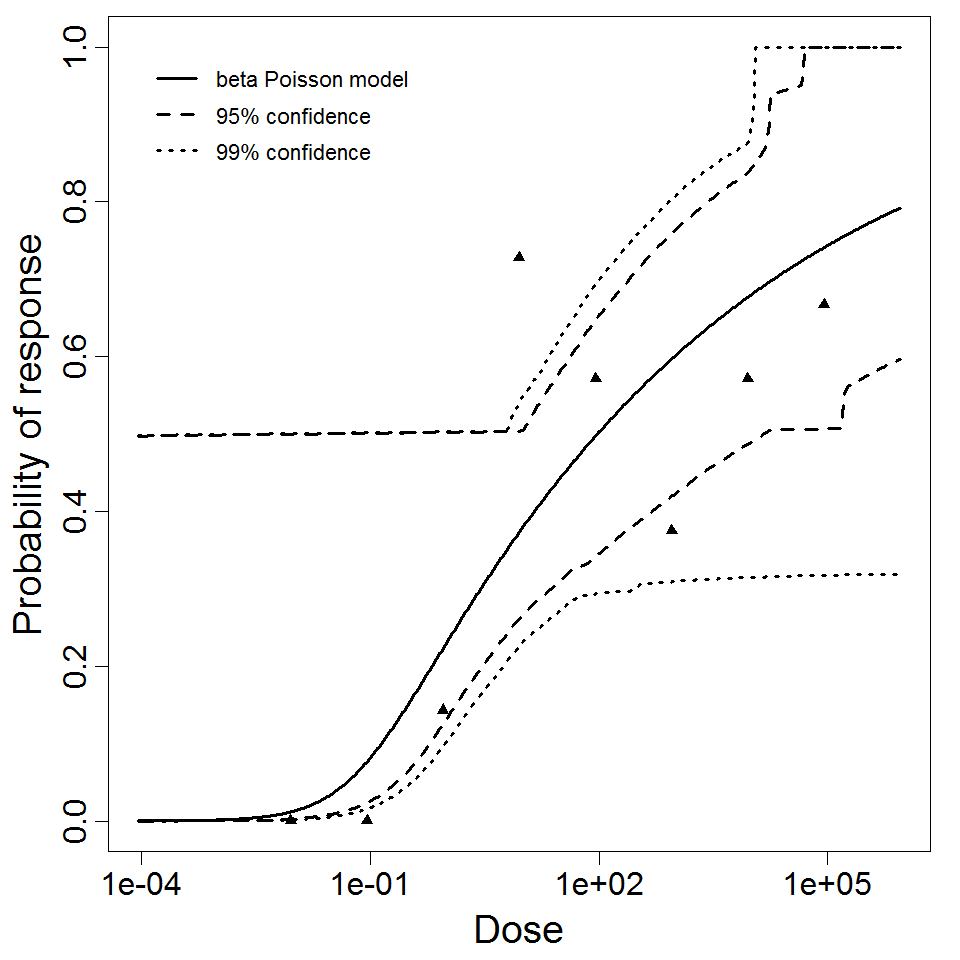
Exponential model plot, with confidence bounds around optimized model
# of Doses
5.00
Μodel
N50
1.52E+05
LD50/ID50
1.52E+05
Dose Units
Response
Exposure Route
Contains Preferred Model
a
1.09E-01
Experiment ID
298
Host type
Description
|
|
||||||||||||||||||||||
|
||||||||||||||||||||||||||||||

Parameter histogram for exponential model (uncertainty of the parameter)
Exponential model plot, with confidence bounds around optimized model
# of Doses
5.00
Μodel
N50
6.57E+03
LD50/ID50
6.57E+03
Dose Units
Response
Exposure Route
Contains Preferred Model
a
3.55E-01
Experiment ID
297
Host type
Description
|
||||||||||||||||||||||
|
||||||||||||||||||||||||||||||
Parameter histogram for exponential model (uncertainty of the parameter)
Exponential model plot, with confidence bounds around optimized model
# of Doses
10.00
Μodel
N50
1.85E+04
LD50/ID50
1.85E+04
Dose Units
Response
Exposure Route
Contains Preferred Model
a
1.9E-01
Experiment ID
297 & 298
Host type
Description
|
| ||||||||||||||||||||||
| ||||||||||||||||||||||||||||||

# of Doses
8.00
Μodel
N50
96.1
LD50/ID50
96.1
Dose Units
Response
Exposure Route
Contains Preferred Model
a
9.6E-2
Agent Strain
CJN strain (unpassaged
Experiment ID
125
Host type
Experiment Dataset
Description
|
|
||||||||||||||||||||||
|
||||||||||||||||||||||||||||||
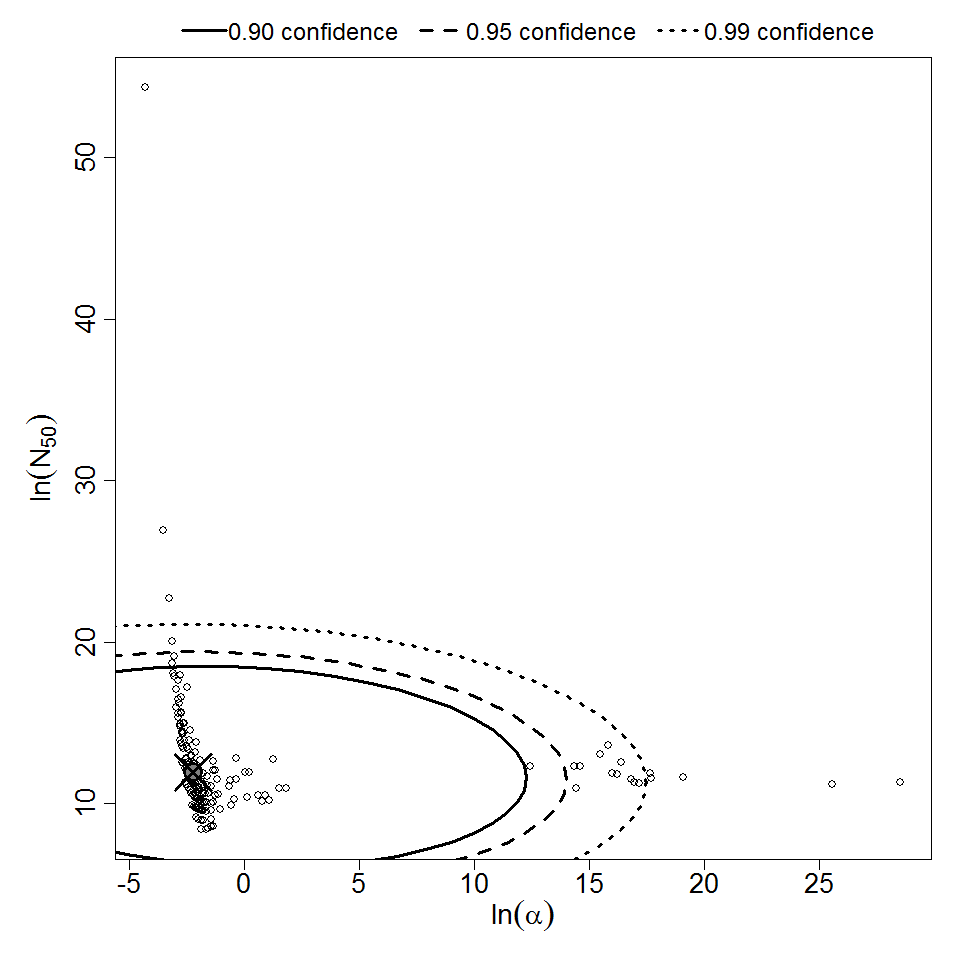
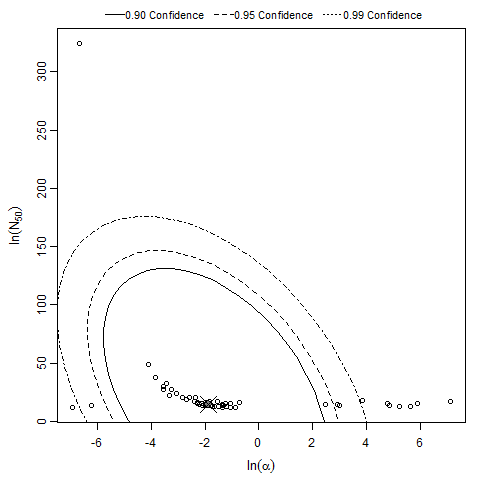
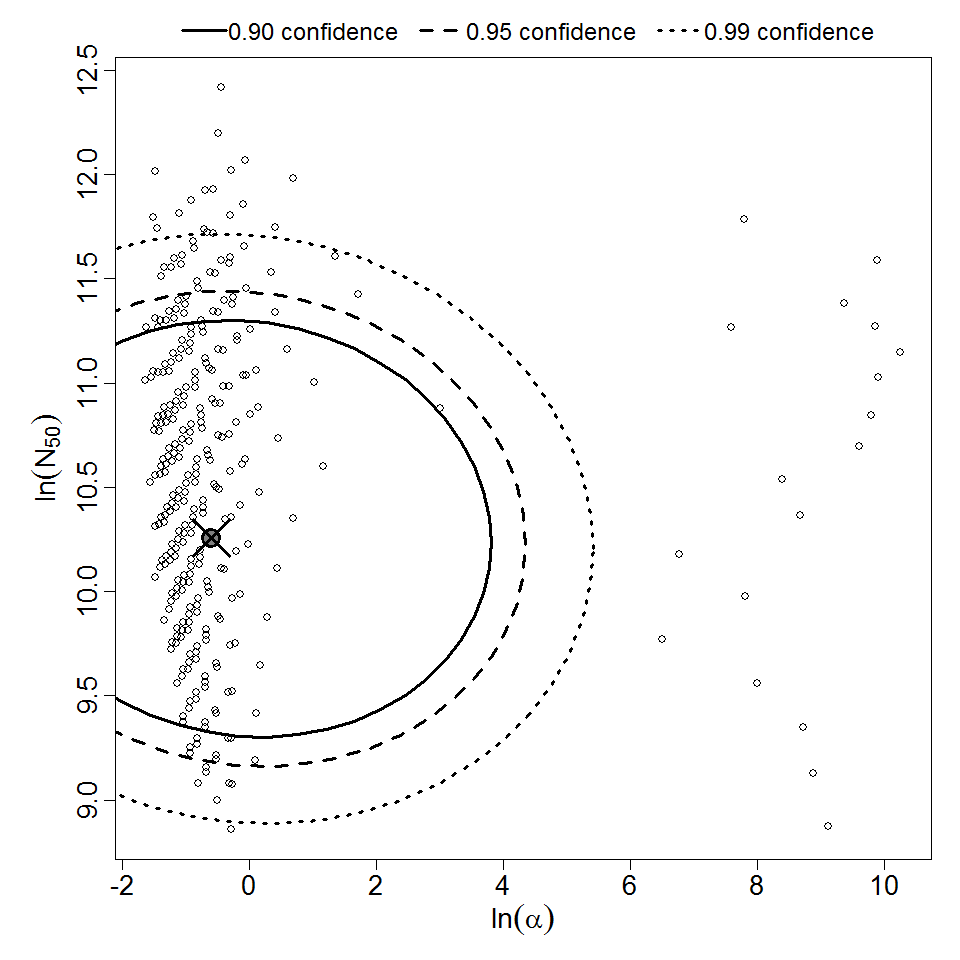
Parameter scatter plot for beta Poisson model ellipses signify the 0.9, 0.95 and 0.99 confidence of the parameters.
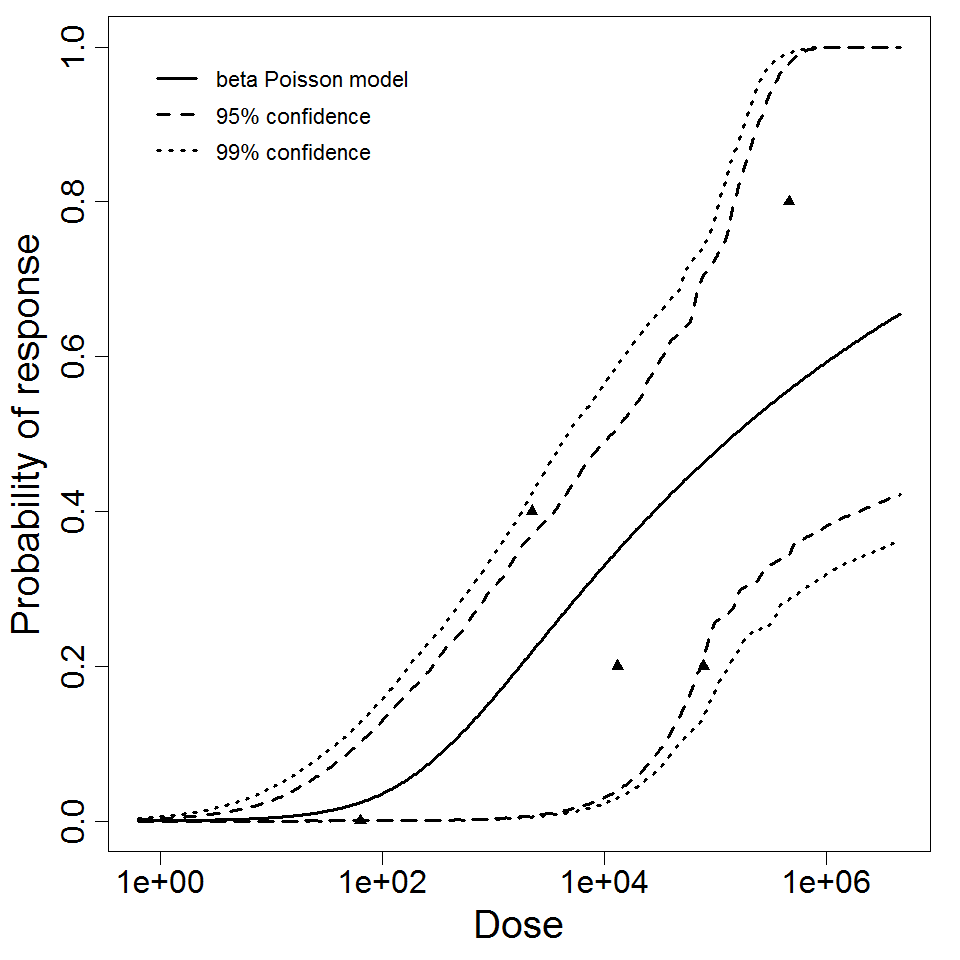
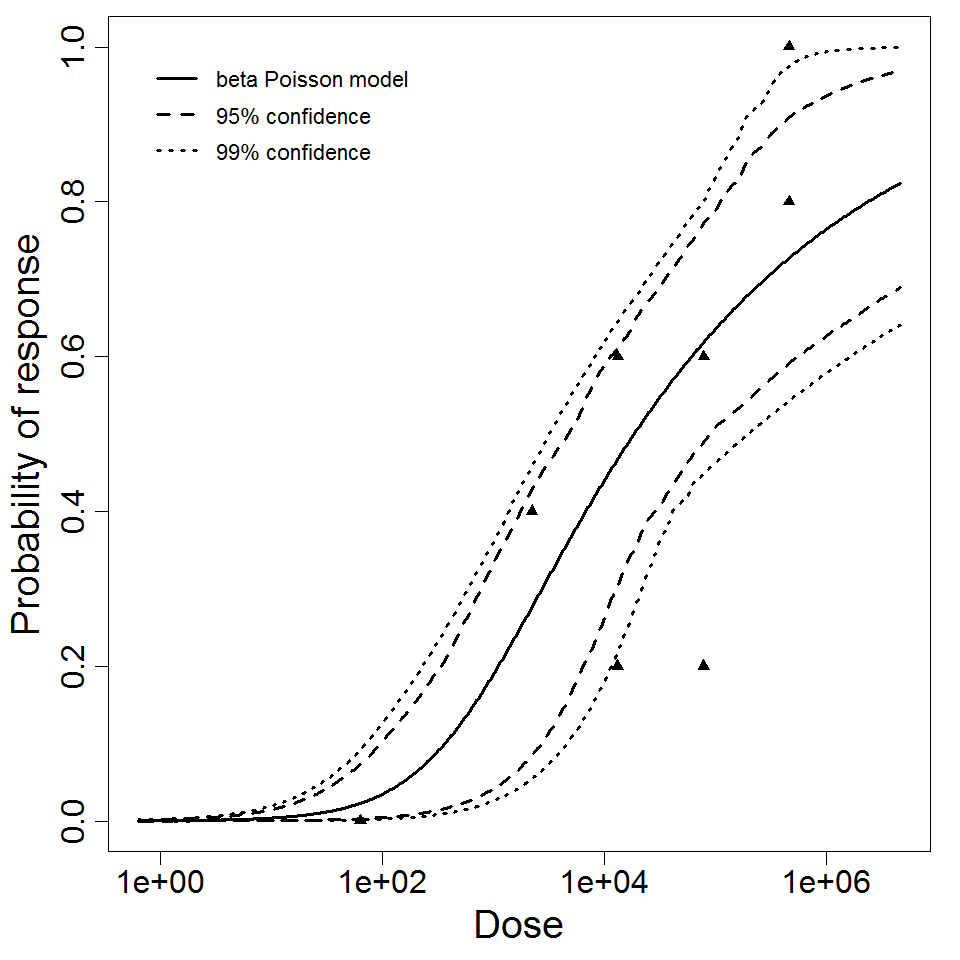
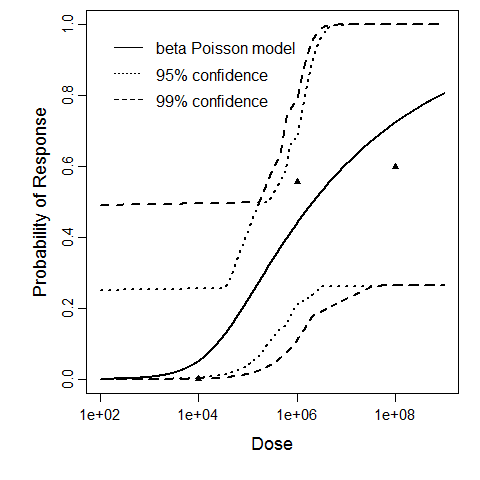
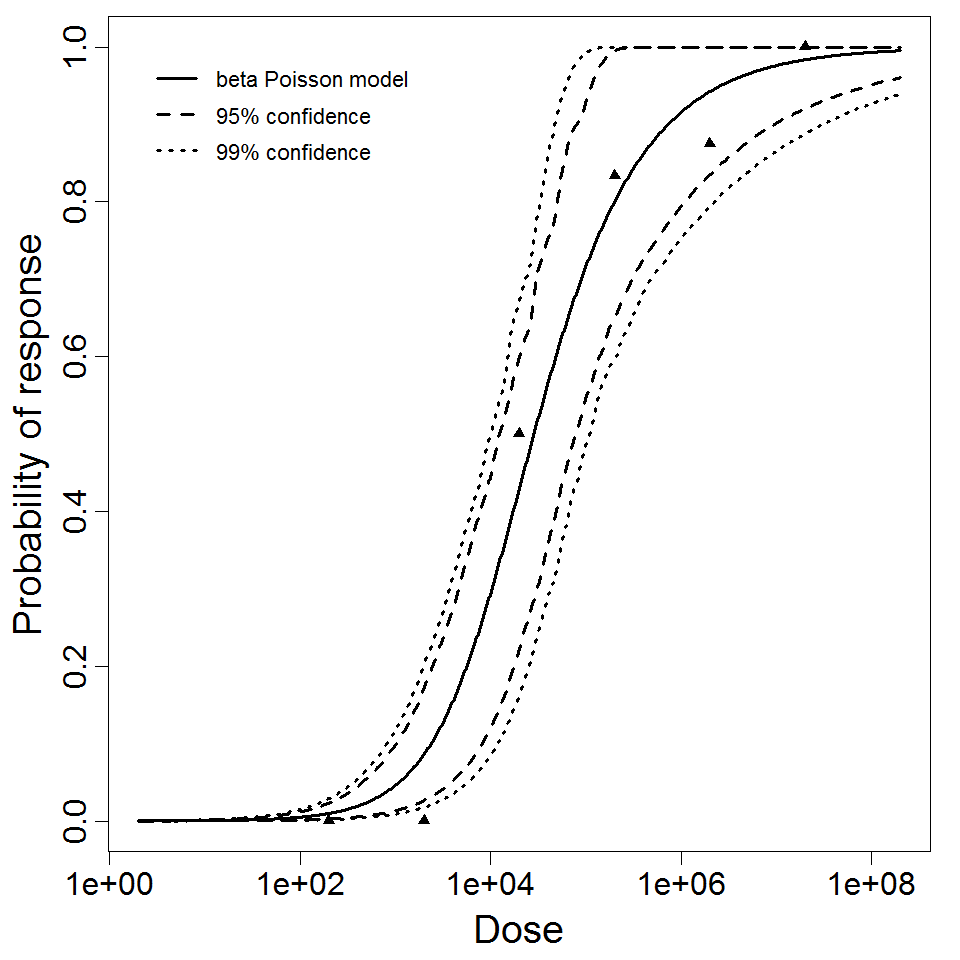
beta Poisson model plot, with confidence bounds around optimized model
# of Doses
8.00
Μodel
N50
1.47E+03
LD50/ID50
1.47E+03
Dose Units
Response
Exposure Route
Contains Preferred Model
a
7.28E-02
Agent Strain
CJN strain (unpassaged)
Experiment ID
71
Host type
Description
|
| ||||||||||||||||||||||
| ||||||||||||||||||||||||||||||
# of Doses
3.00
Μodel
N50
2.11E+06
LD50/ID50
2.11E+06
Dose Units
Response
Exposure Route
Contains Preferred Model
a
1.55E-01
Agent Strain
EIEC 1624
Experiment ID
98
Host type
Experiment Dataset
Description
|
| ||||||||||||||||||||||
| ||||||||||||||||||||||||||||||
# of Doses
7.00
Μodel
N50
1.78E+05
LD50/ID50
1.78E+05
Dose Units
Response
Exposure Route
Contains Preferred Model
a
3.75E-01
Agent Strain
ETEC B7A
Experiment ID
96, 100, 166
Host type
Experiment Dataset
Description
|
|
||||||||||||||||||||||
|
||||||||||||||||||||||||||||||
Parameter scatter plot for beta Poisson model ellipses signify the 0.9, 0.95 and 0.99 confidence of the parameters.
beta Poisson model plot, with confidence bounds around optimized model
# of Doses
6.00
Μodel
N50
2.85E+04
LD50/ID50
2.85E+04
Dose Units
Response
Exposure Route
Contains Preferred Model
a
5.49E-01
Agent Strain
Vollum
Experiment ID
84
Host type