\[P(response)=1-exp(-k\times dose)\]
Description
|
|
||||||||||||||||||||||
|
||||||||||||||||||||||||||||||||||||||
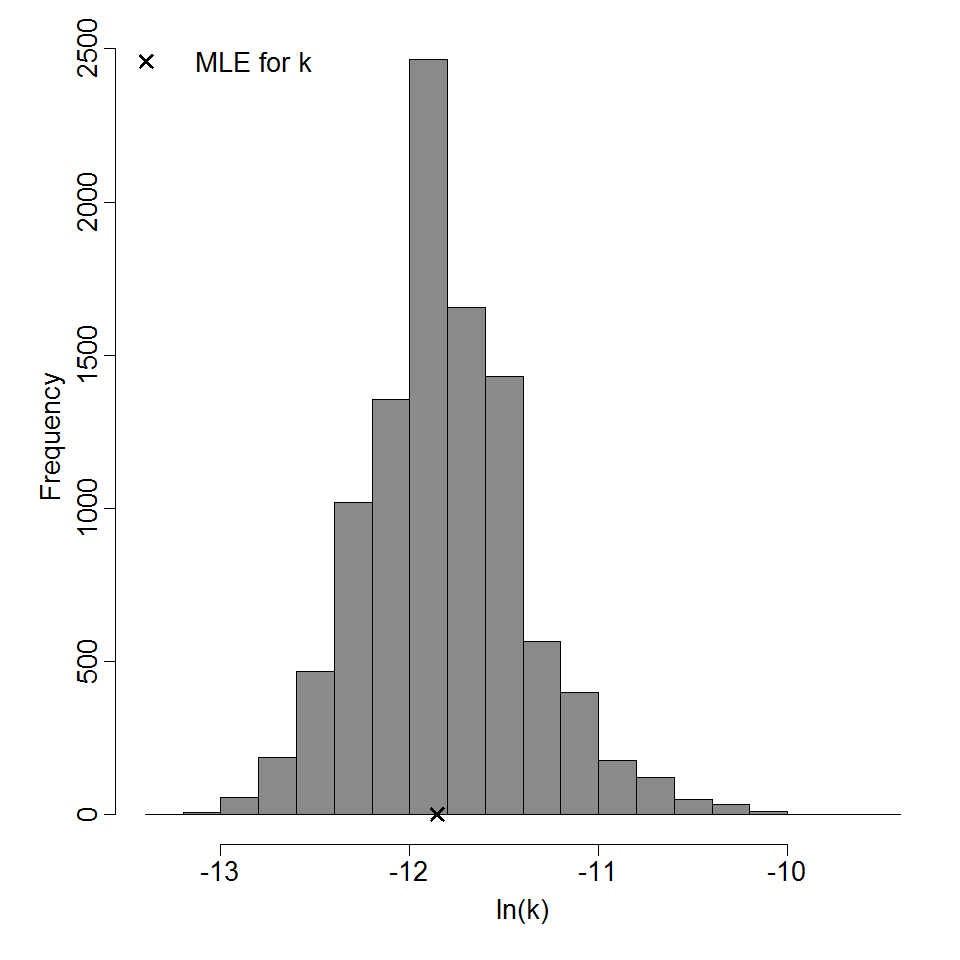
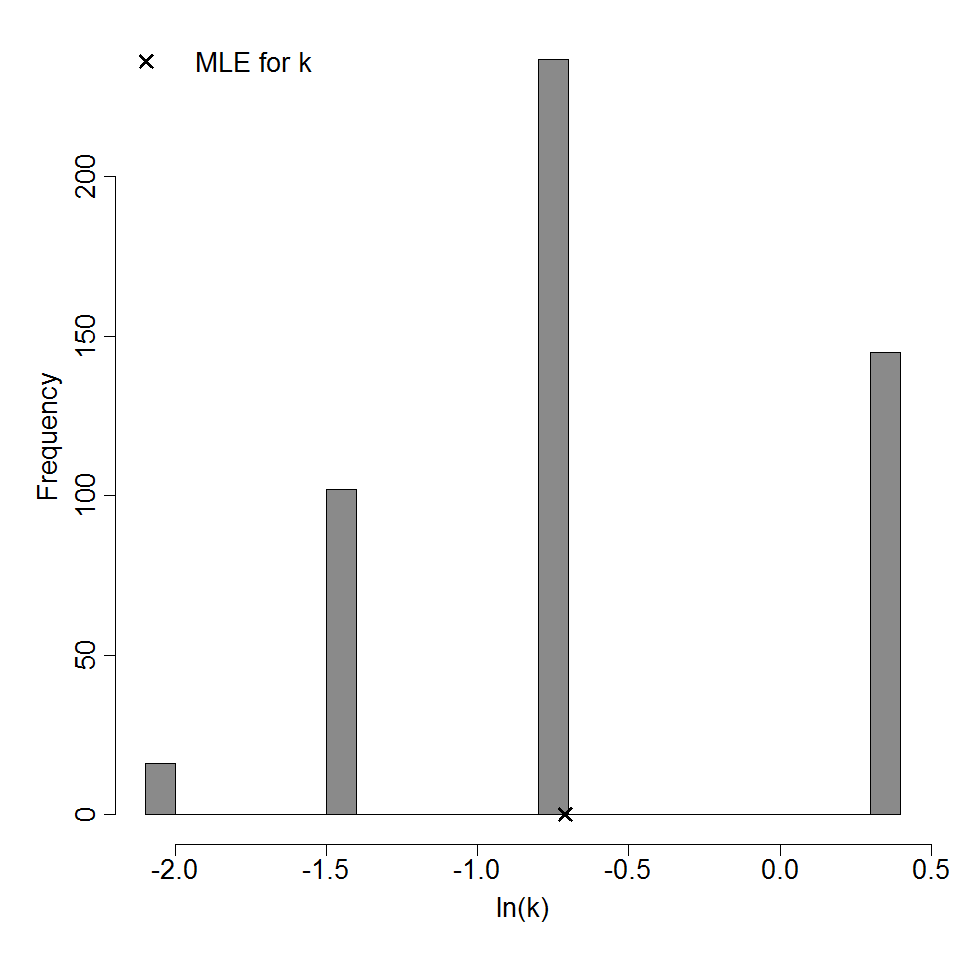
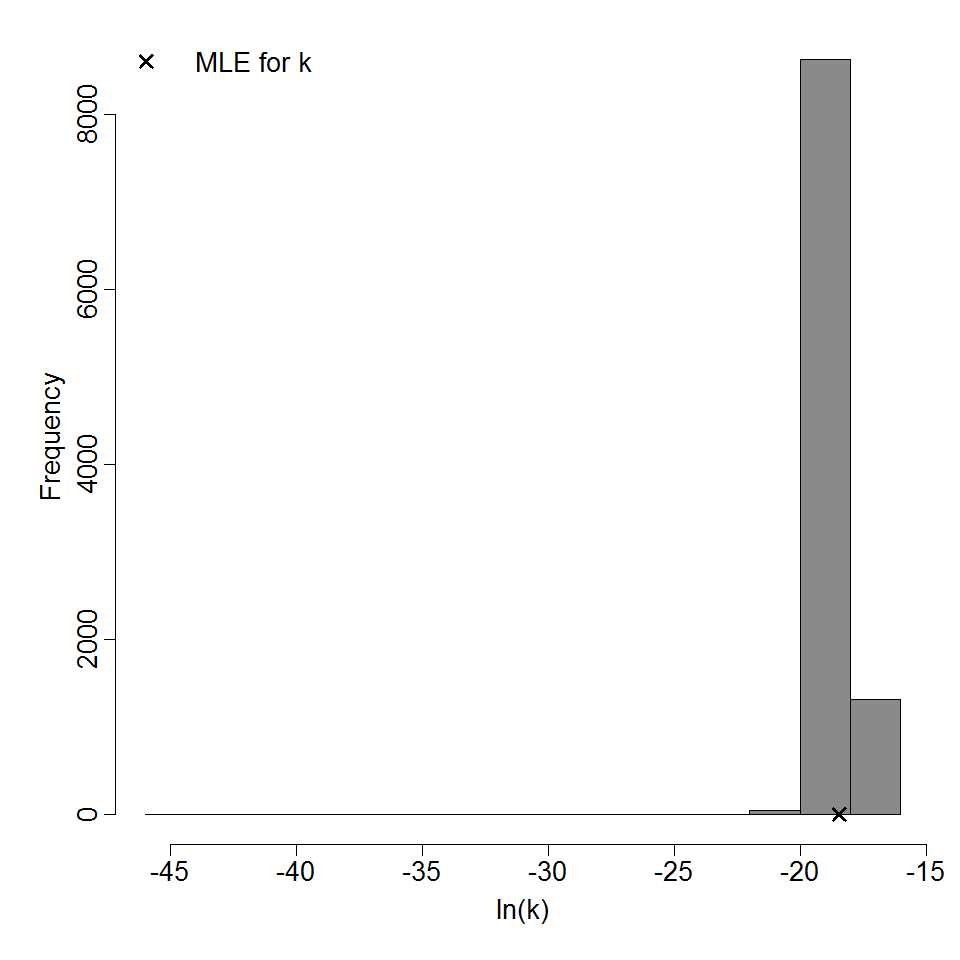
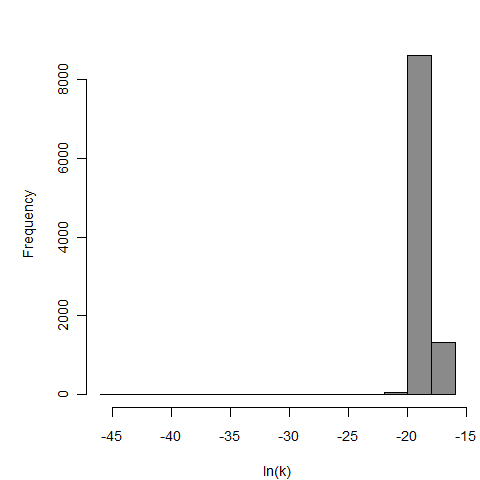
Parameter histogram for exponential model (uncertainty of the parameter)
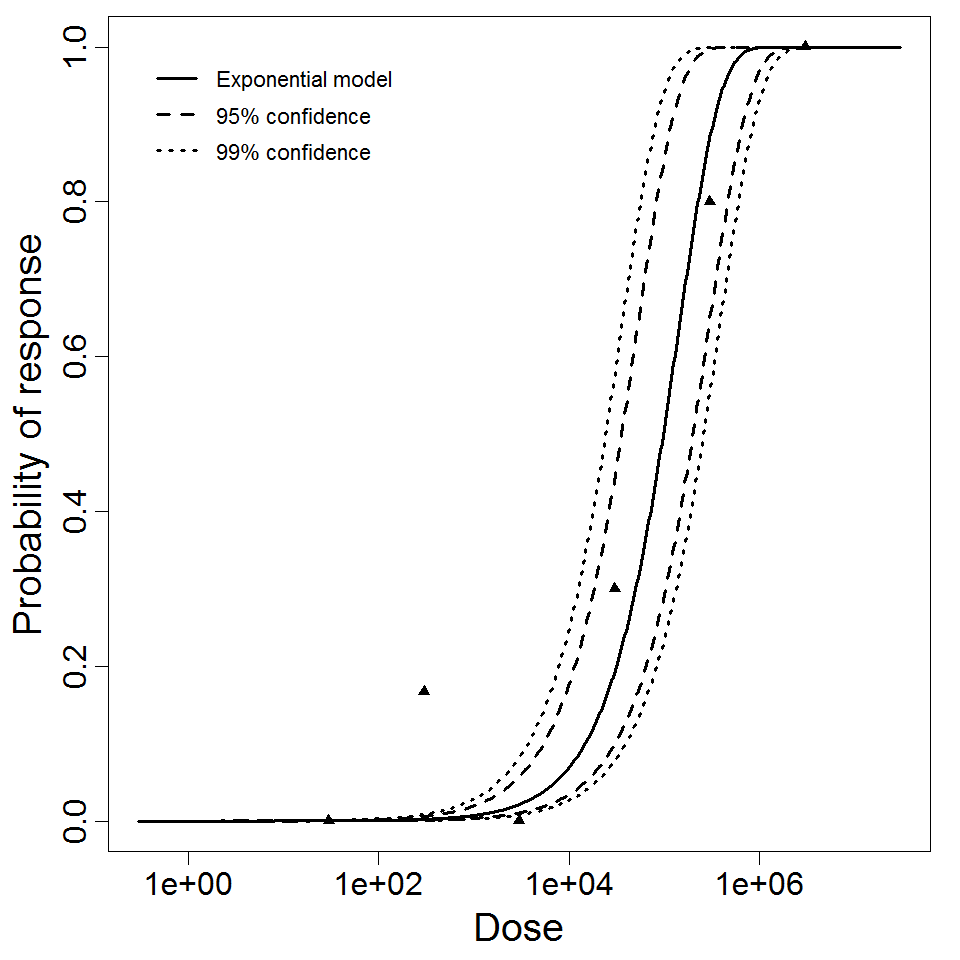
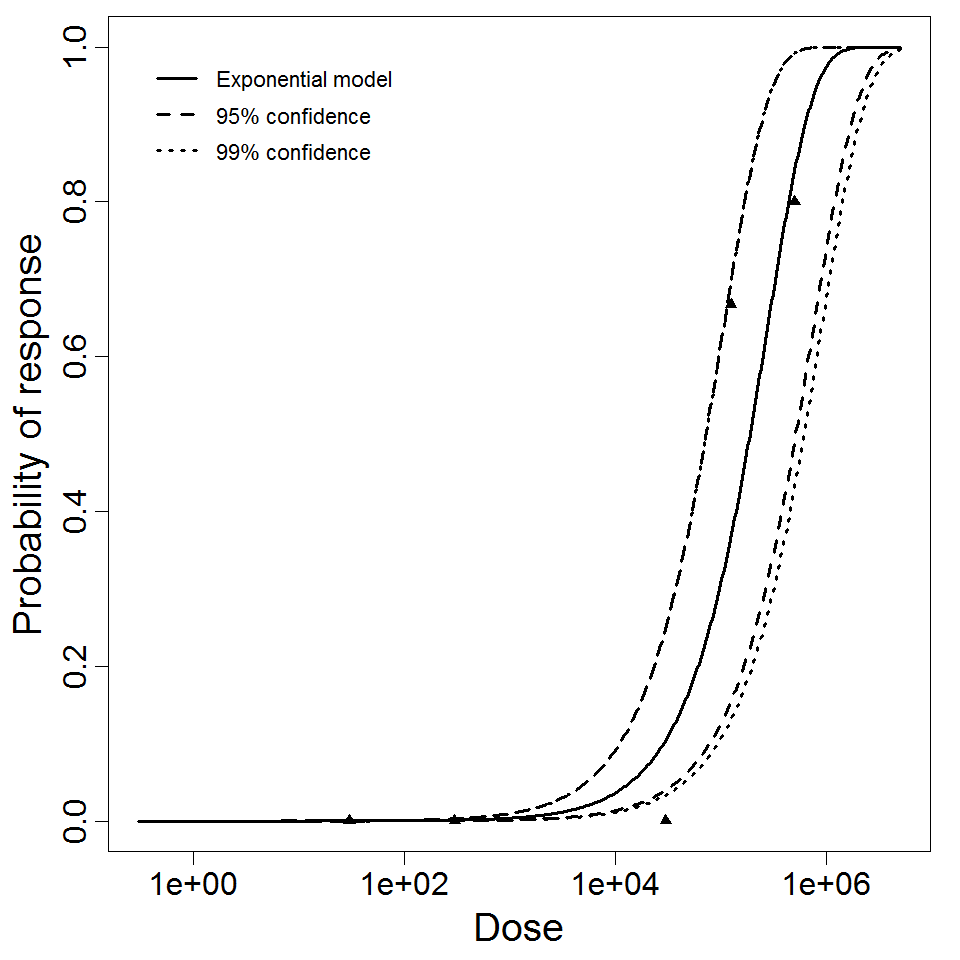
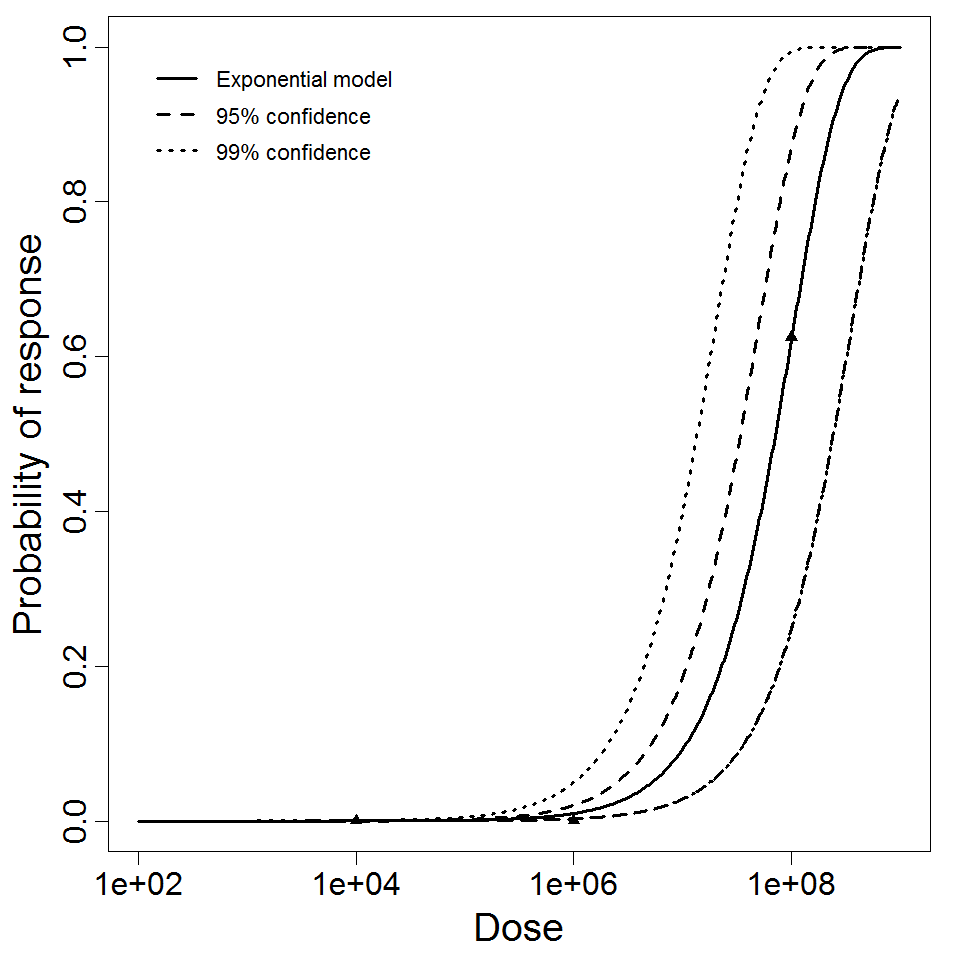
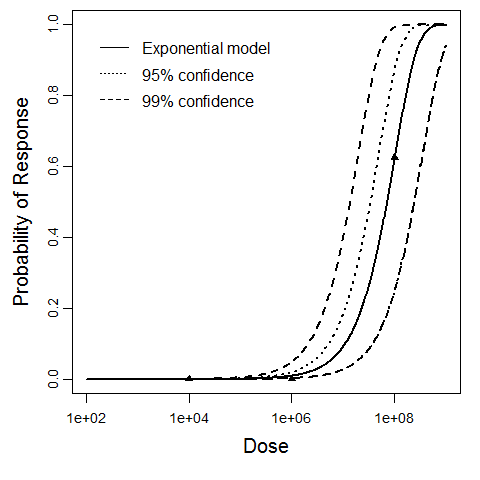
Exponential model plot, with confidence bounds around optimized model
# of Doses
6.00
Μodel
LD50/ID50
9.75E+04
Dose Units
Response
Exposure Route
Contains Preferred Model
k
7.11E-06
Agent Strain
ATCC 6605
Experiment ID
85
Host type
Description
|
|
||||||||||||||||||||||
|
||||||||||||||||||||||||||||||||||||||
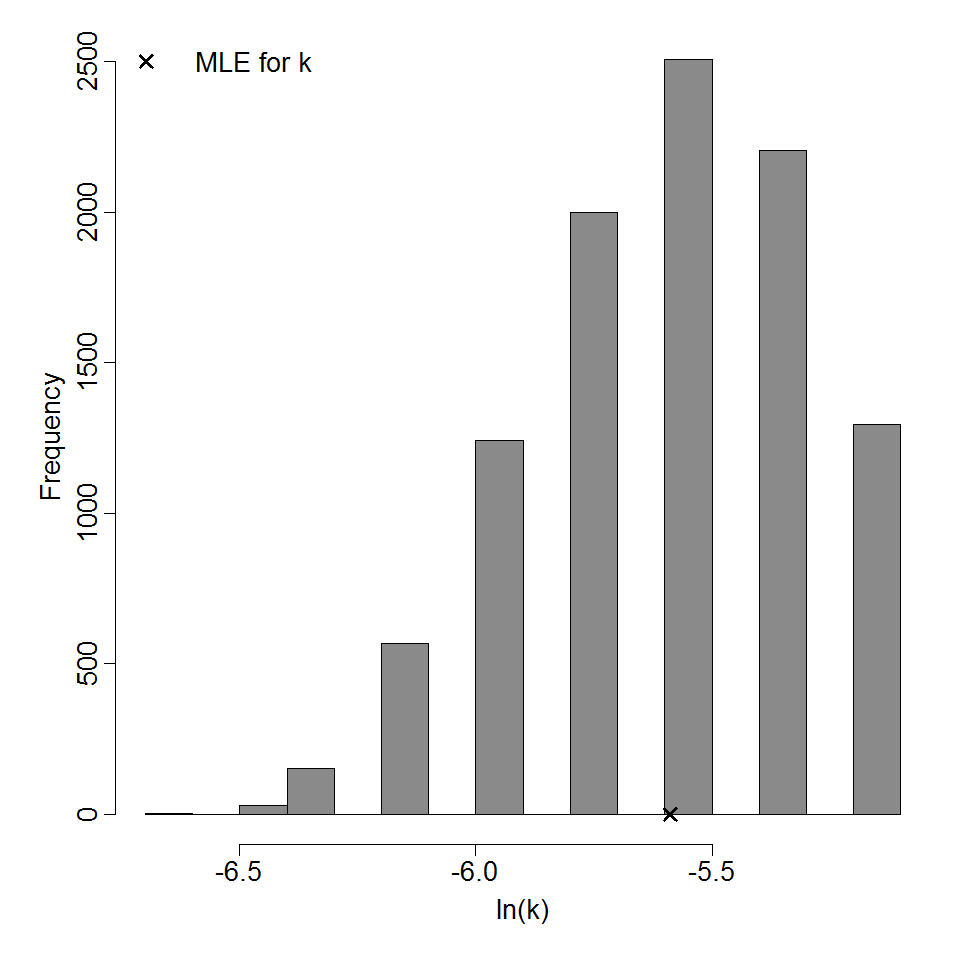
Parameter histogram for exponential model (uncertainty of the parameter)
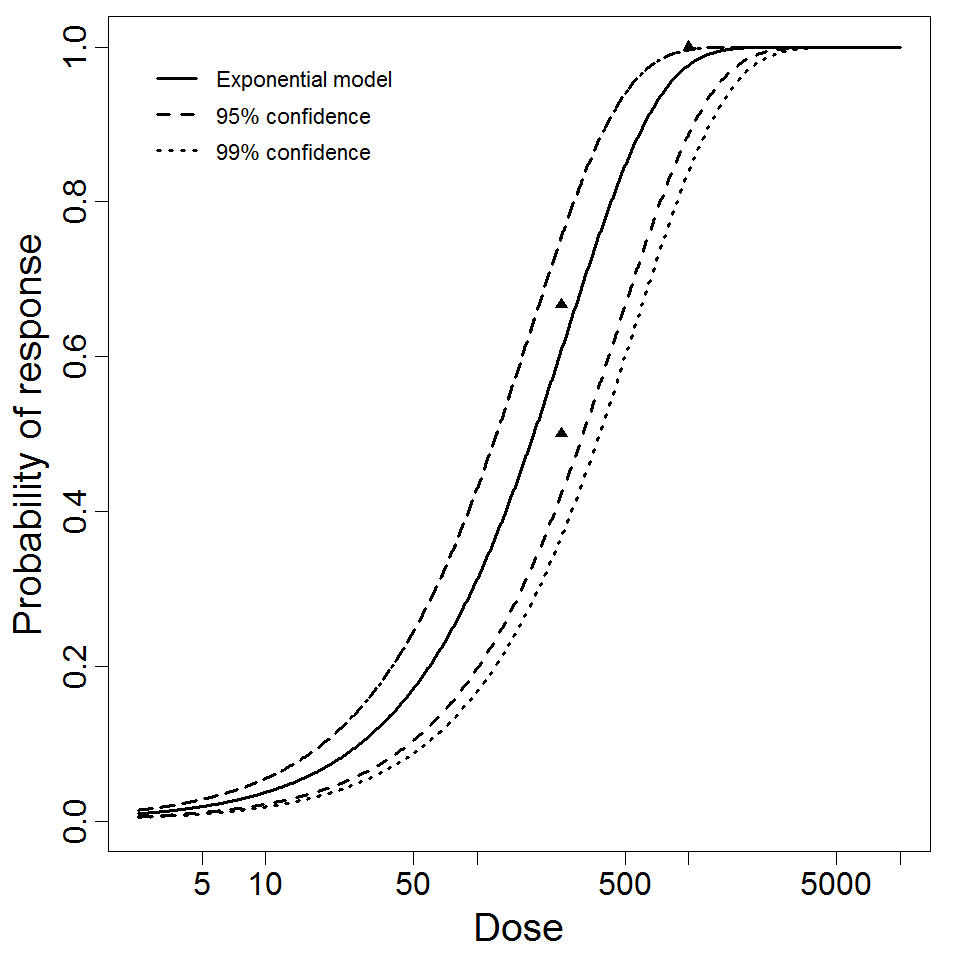
Exponential model plot, with confidence bounds around optimized model
# of Doses
3.00
Μodel
LD50/ID50
1.85E+02
Dose Units
Response
Exposure Route
Contains Preferred Model
k
3.74E-03
Agent Strain
porcine, PE7-05i
Experiment ID
63
Host type
Description
|
|
||||||||||||||||||||||
|
||||||||||||||||||||||||||||||||||||||
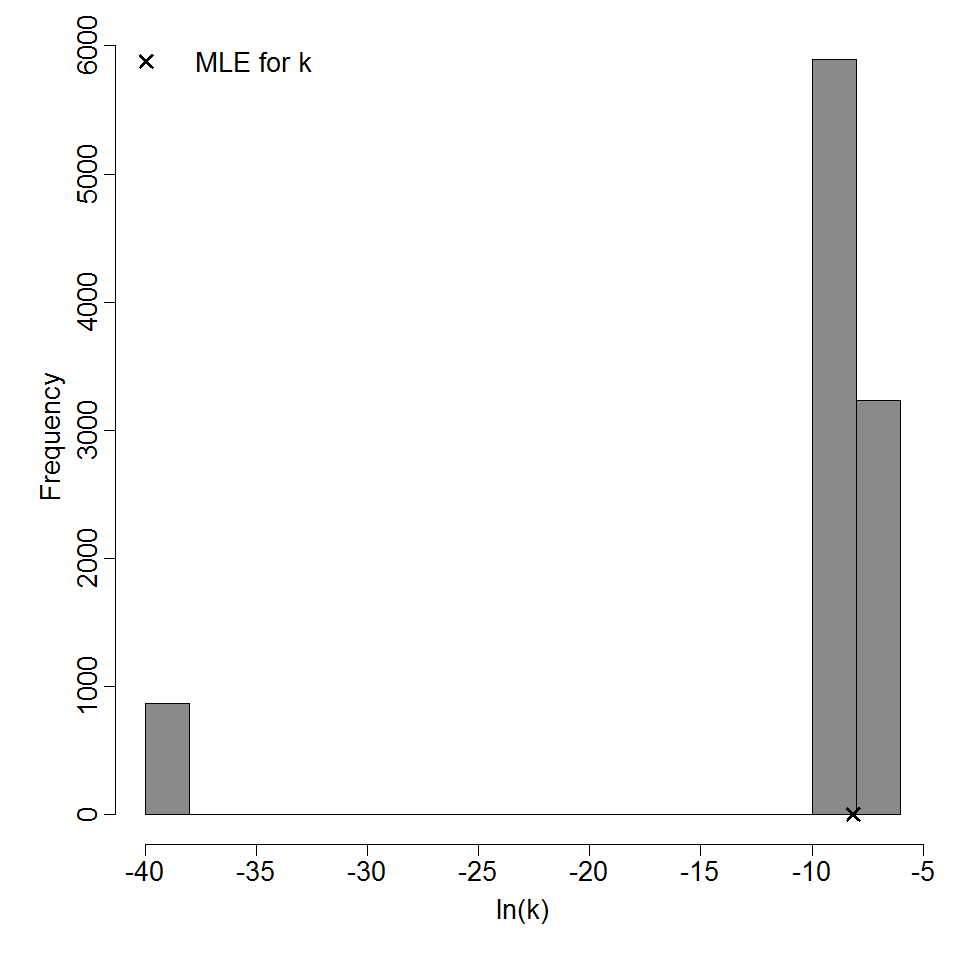
Parameter histogram for exponential model (uncertainty of the parameter)
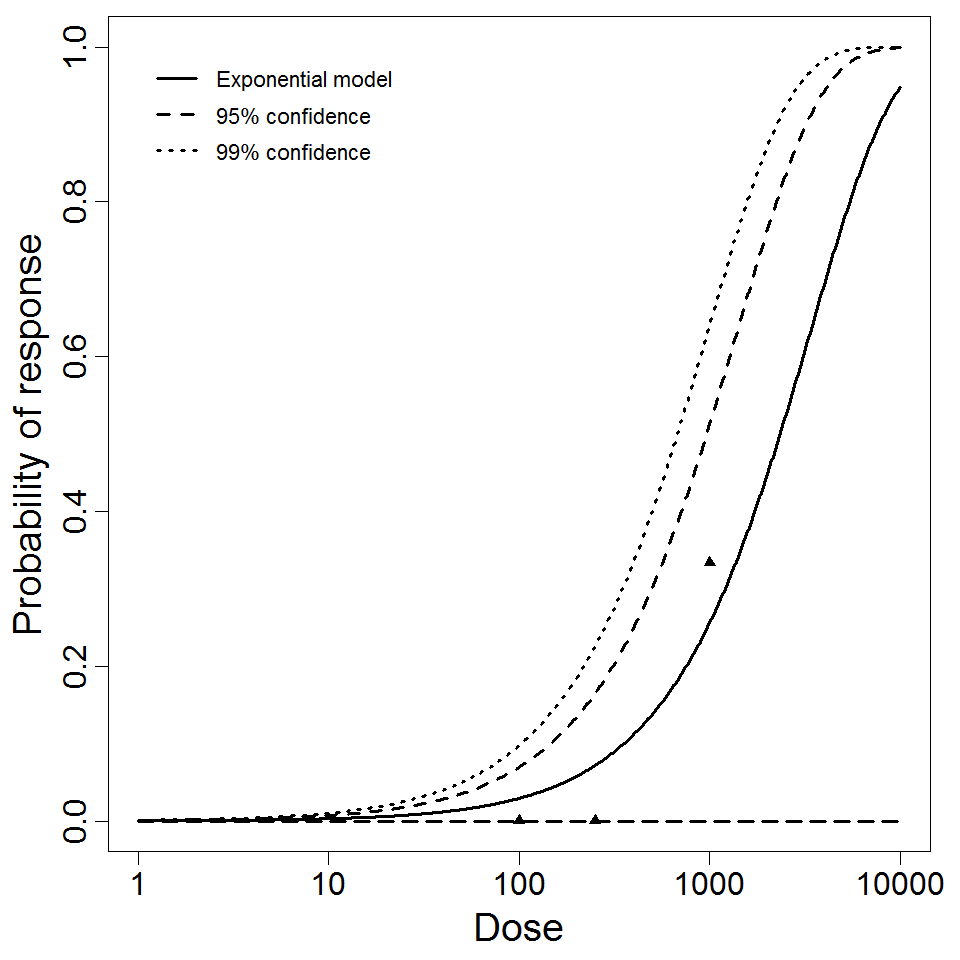
Exponential model plot, with confidence bounds around optimized model
# of Doses
3.00
Μodel
LD50/ID50
2.34E+03
Dose Units
Response
Exposure Route
Contains Preferred Model
k
2.96E-04
Agent Strain
porcine, PE3-ECPO-6
Experiment ID
62
Host type
Description
|
|
||||||||||||||||||||||
|
||||||||||||||||||||||||||||||||||||||
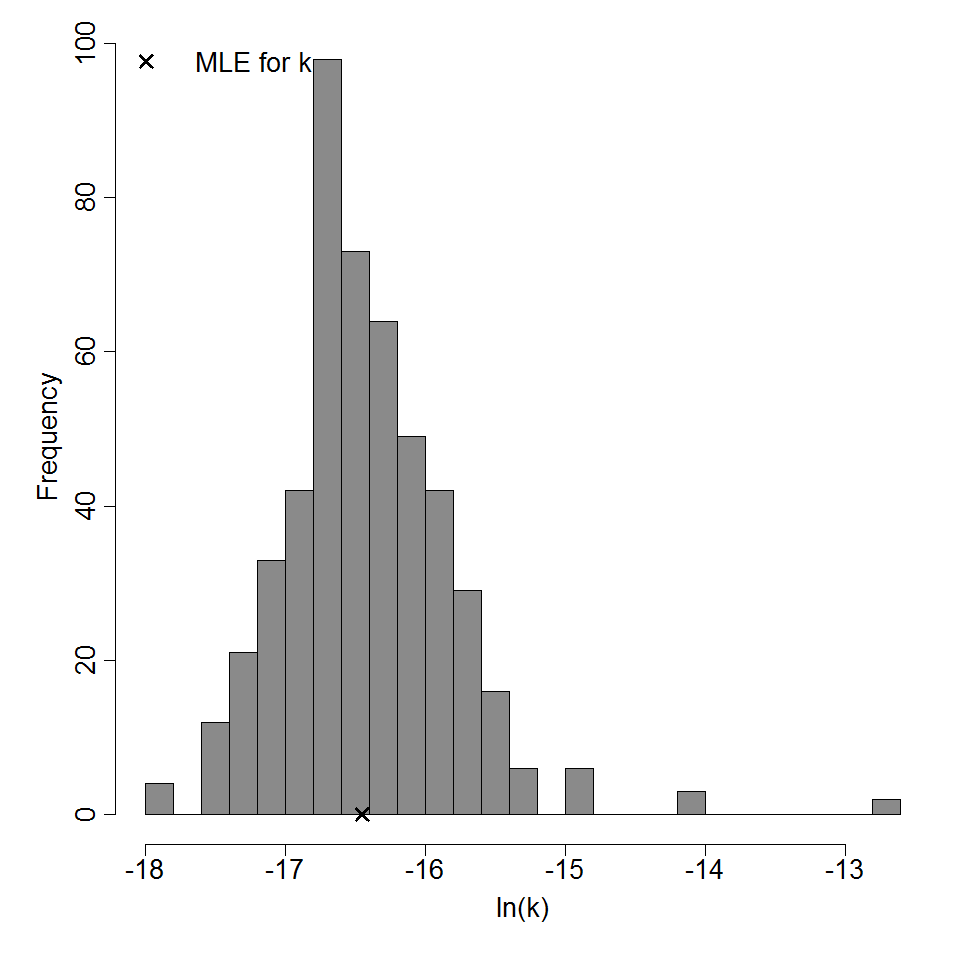
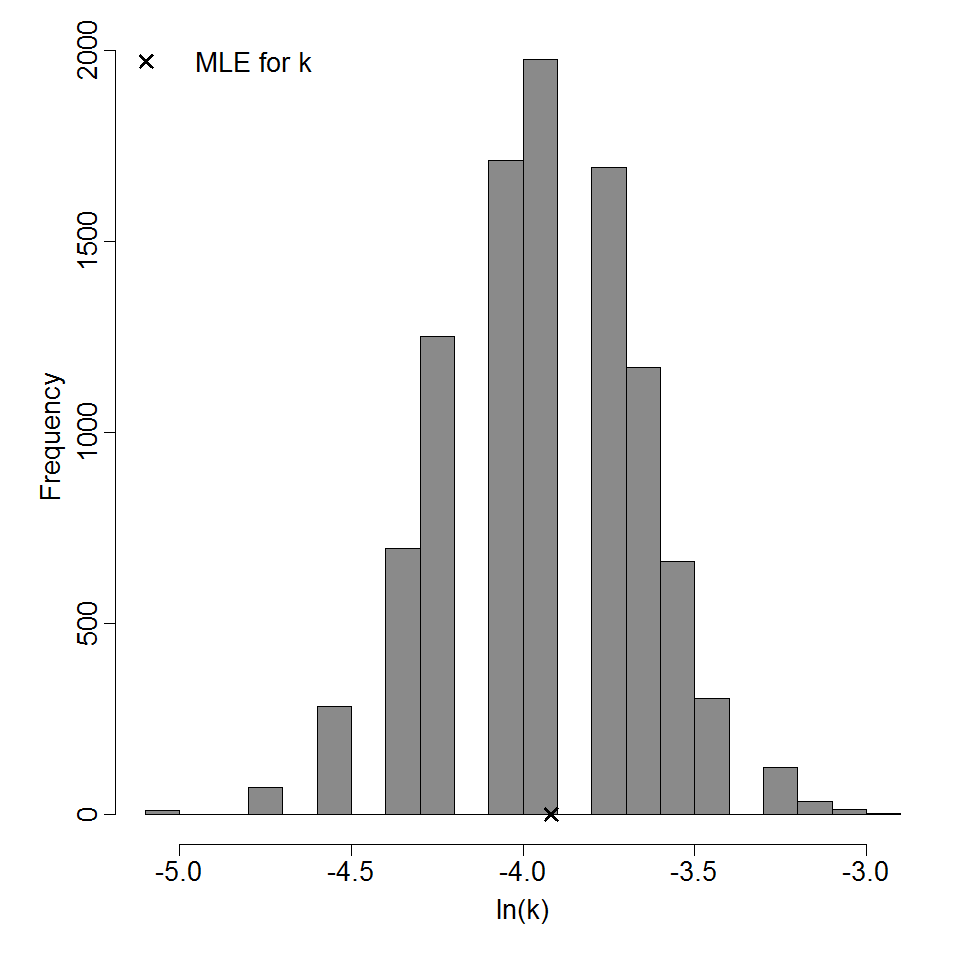
Parameter histogram for exponential model (uncertainty of the parameter)
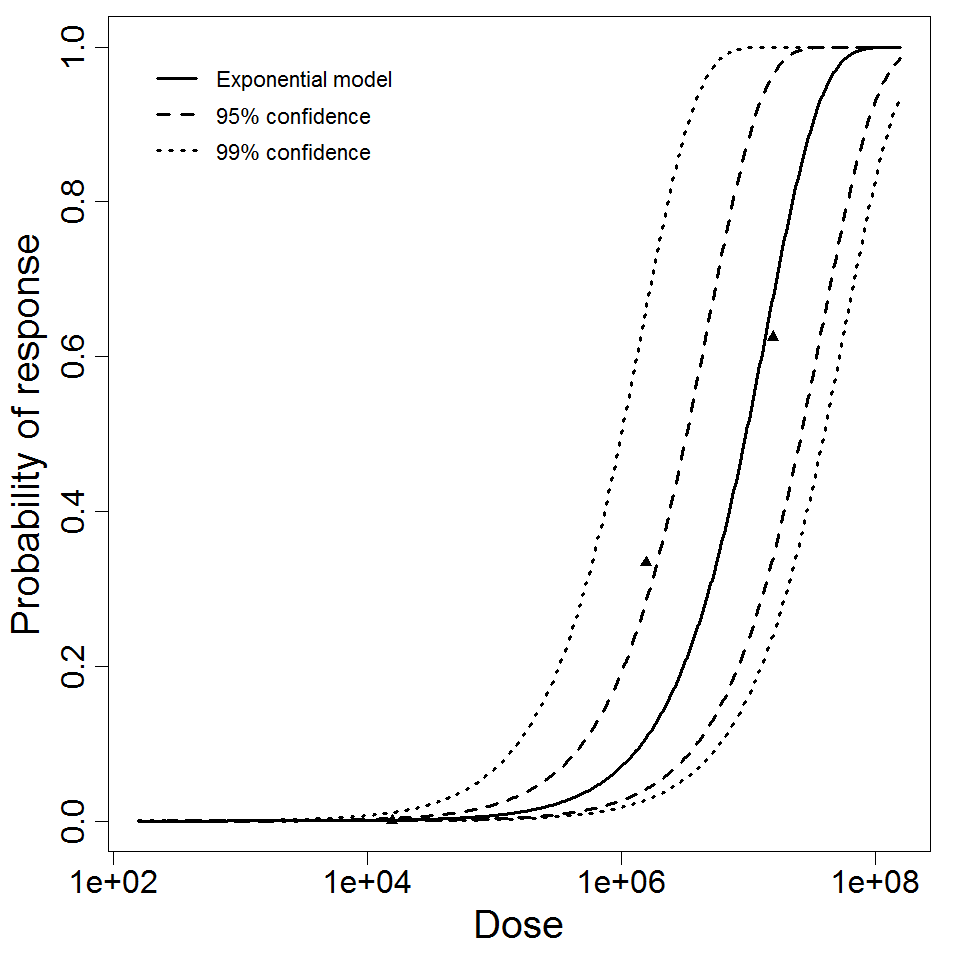
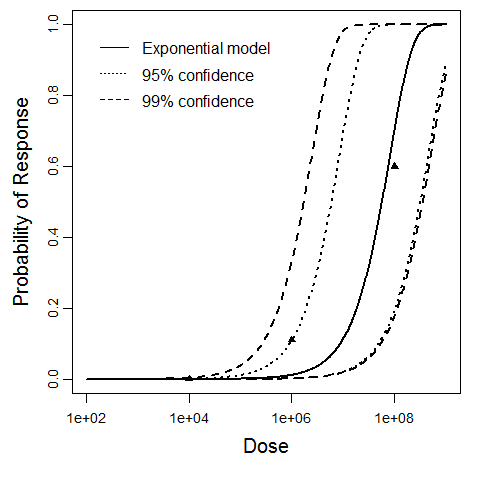
Exponential model plot, with confidence bounds around optimized model
# of Doses
3.00
Μodel
LD50/ID50
9.66E+06
Dose Units
Response
Exposure Route
Contains Preferred Model
k
7.18E-08
Agent Strain
type 2,attenuated
Experiment ID
59
Host type
Description
|
|
||||||||||||||||||||||
|
||||||||||||||||||||||||||||||||||||||
Parameter histogram for exponential model (uncertainty of the parameter)

Exponential model plot, with confidence bounds around optimized model
# of Doses
3.00
Μodel
LD50/ID50
1.41E+00
Dose Units
Response
Exposure Route
Contains Preferred Model
k
4.91E-01
Agent Strain
type 1,attenuated
Experiment ID
56
Host type
Description
|
|
||||||||||||||||||||||
|
||||||||||||||||||||||||||||||||||||||

Parameter histogram for exponential model (uncertainty of the parameter)
Exponential model plot, with confidence bounds around optimized model
# of Doses
5.00
Μodel
LD50/ID50
1.89E+05
Dose Units
Response
Exposure Route
Contains Preferred Model
k
3.68E-06
Agent Strain
From infected humans
Experiment ID
48
Host type
Description
|
|
||||||||||||||||||||||
|
||||||||||||||||||||||||||||||||||||||
Parameter histogram for exponential model (uncertainty of the parameter)

Exponential model plot, with confidence bounds around optimized model
# of Doses
8.00
Μodel
LD50/ID50
3.48E+01
Dose Units
Response
Exposure Route
Contains Preferred Model
k
1.99E-02
Agent Strain
From an infected human
Experiment ID
46
Host type
Description
|
| ||||||||||||||||||||||
| ||||||||||||||||||||||||||||||||||||||

# of Doses
3.00
Μodel
LD50/ID50
5.7E+07
Dose Units
Response
Exposure Route
Contains Preferred Model
k
1.22E-08
Agent Strain
EIEC 1624
Experiment ID
40
Host type
Experiment Dataset
Description
|
| ||||||||||||||||||||||
| ||||||||||||||||||||||||||||||||||||||
# of Doses
6.00
Μodel
LD50/ID50
6.5E+07
Dose Units
Response
Exposure Route
Contains Preferred Model
k
1.07E-08
Agent Strain
EIEC 4608
Experiment ID
39, 40
Host type
Experiment Dataset
Description
|
| ||||||||||||||||||||||
| ||||||||||||||||||||||||||||||||||||||
# of Doses
3.00
Μodel
LD50/ID50
7.14E+07
Dose Units
Response
Exposure Route
Contains Preferred Model
k
9.7E-09
Agent Strain
EIEC 4608
Experiment ID
39
Host type
Experiment Dataset