\[P(response)=1-exp(-k\times dose)\]
Description
|
|
||||||||||||||||||||||
|
||||||||||||||||||||||||||||||||||||||
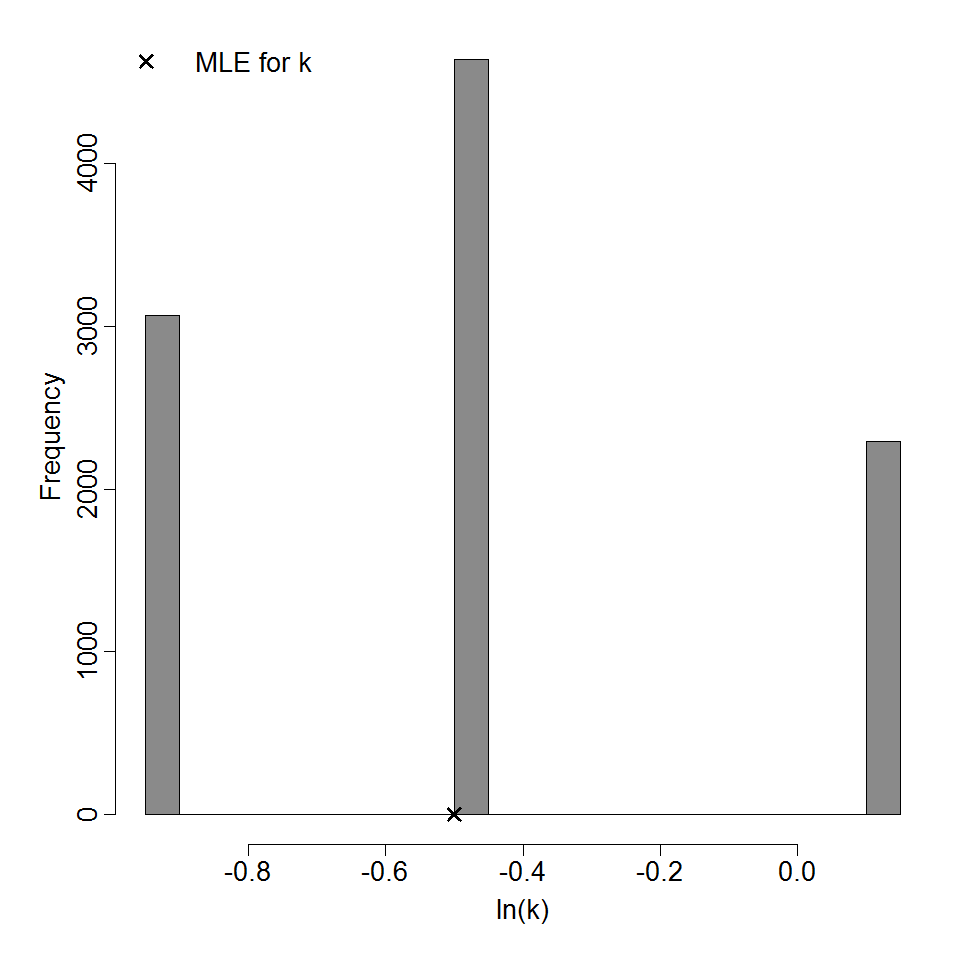
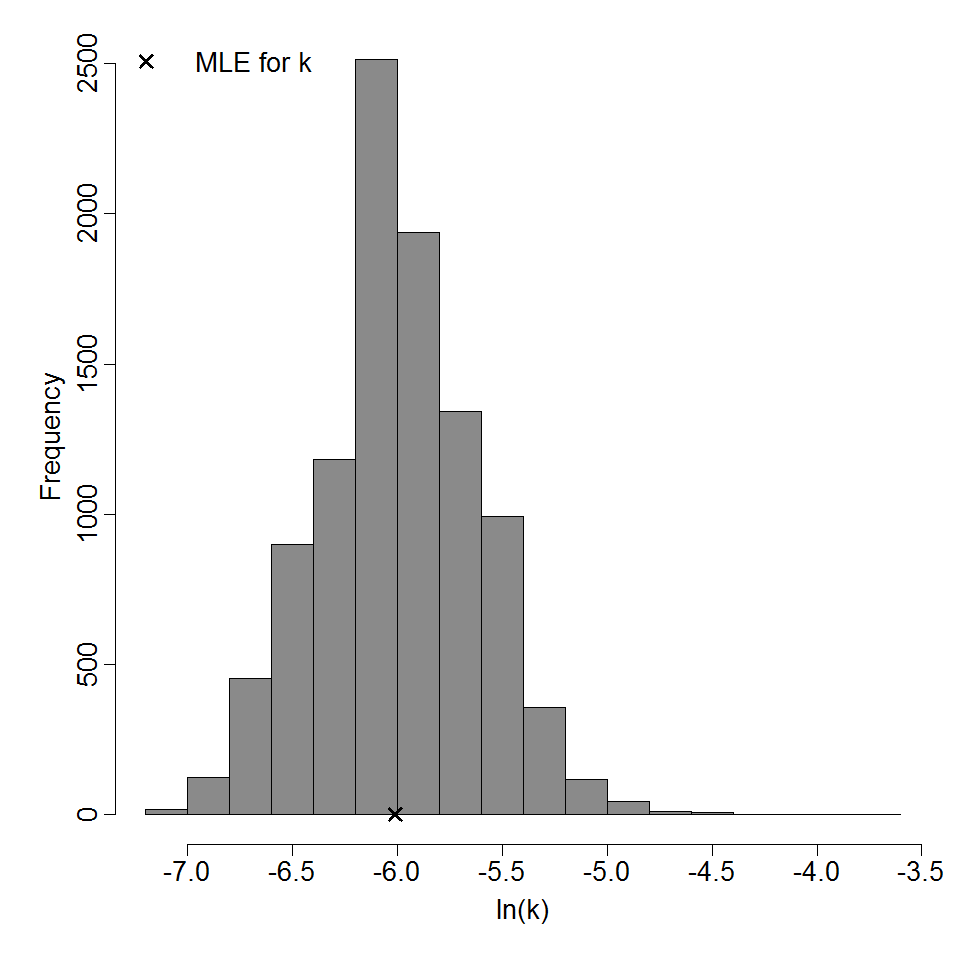
Parameter histogram for exponential model (uncertainty of the parameter)
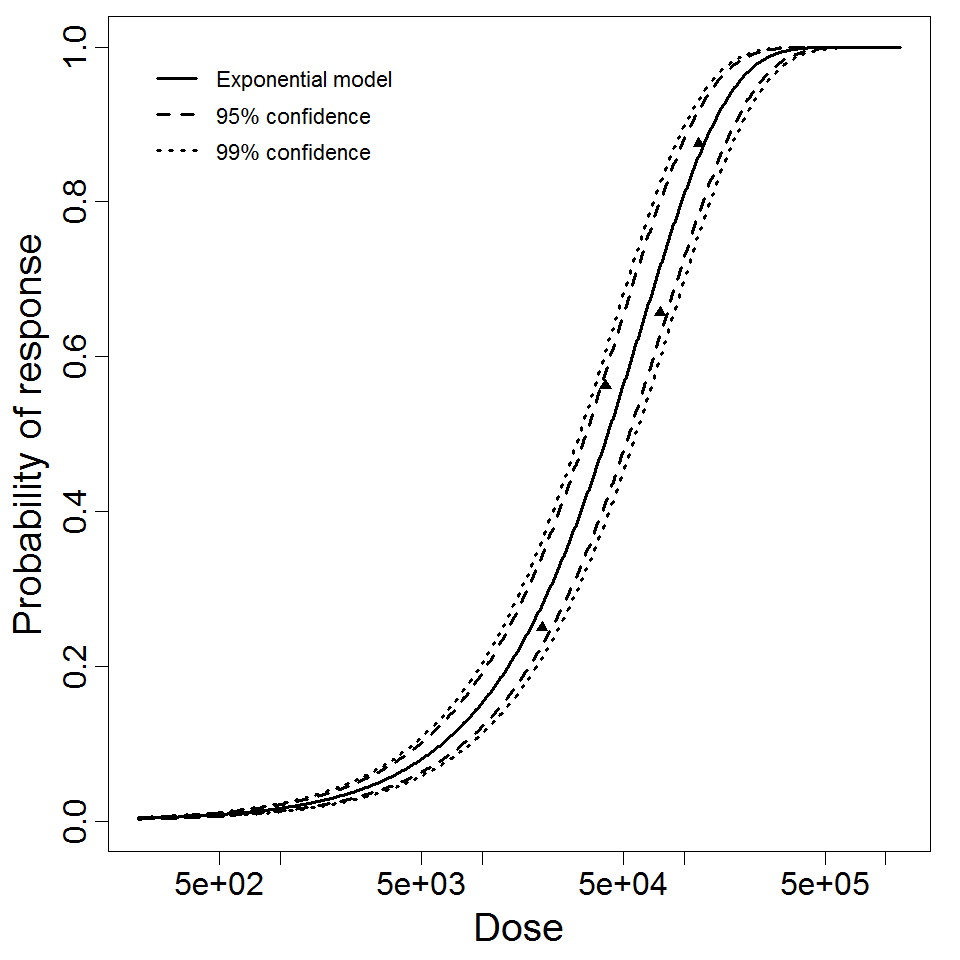
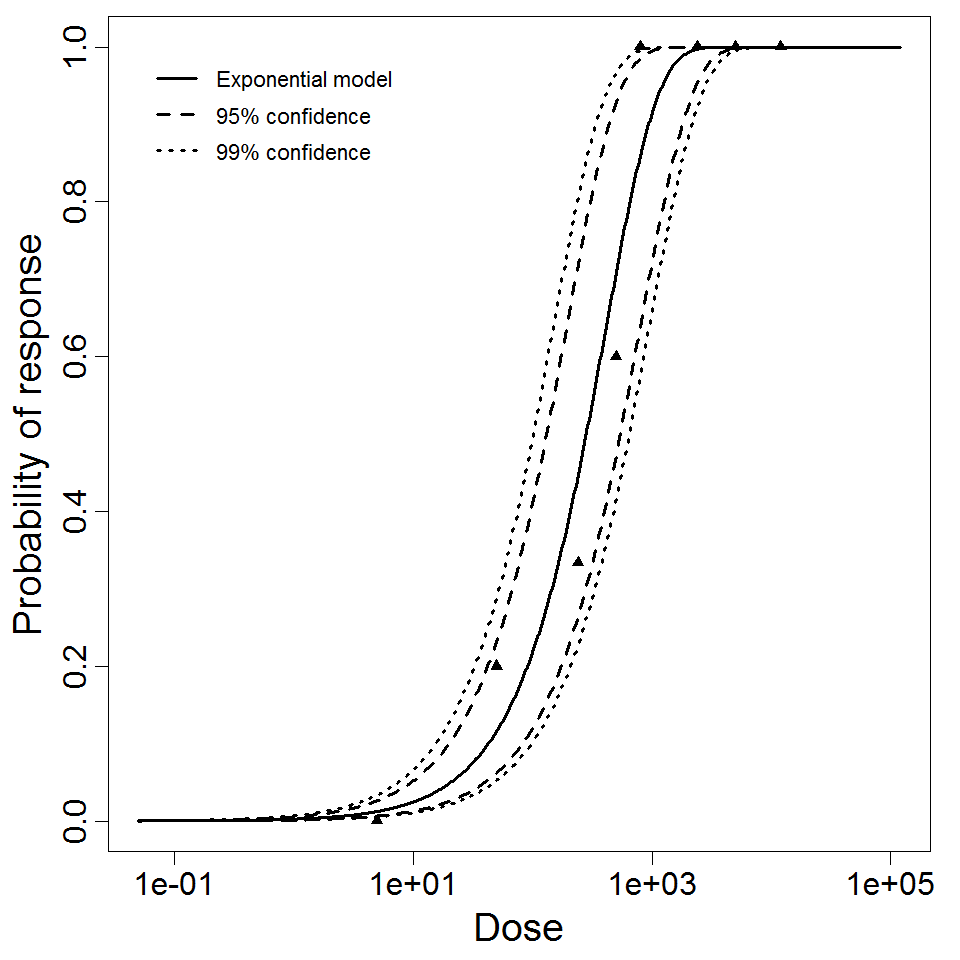
Exponential model plot, with confidence bounds around optimized model
# of Doses
4.00
Μodel
LD50/ID50
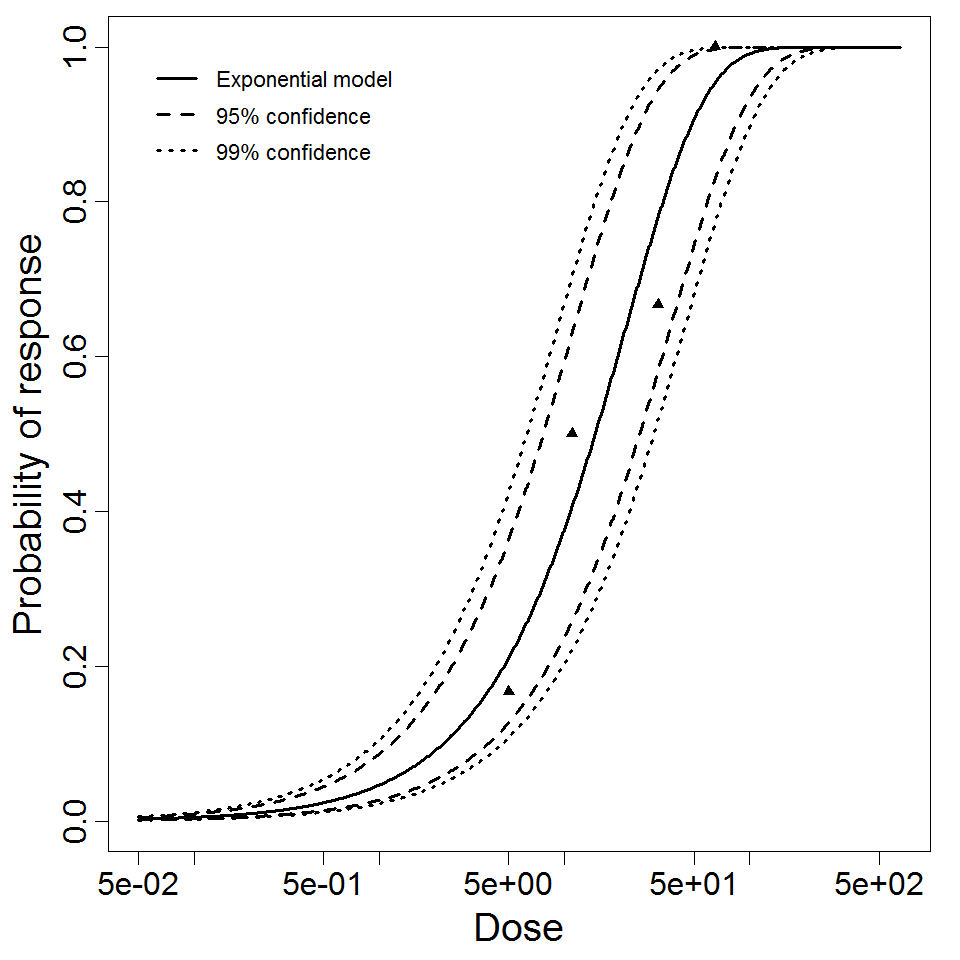
1.14E+00
Dose Units
Response
Exposure Route
Contains Preferred Model
k
6.07E-01
Agent Strain
type 4
Experiment ID
31
Host type
Description
|
|
||||||||||||||||||||||
|
||||||||||||||||||||||||||||||||||||||
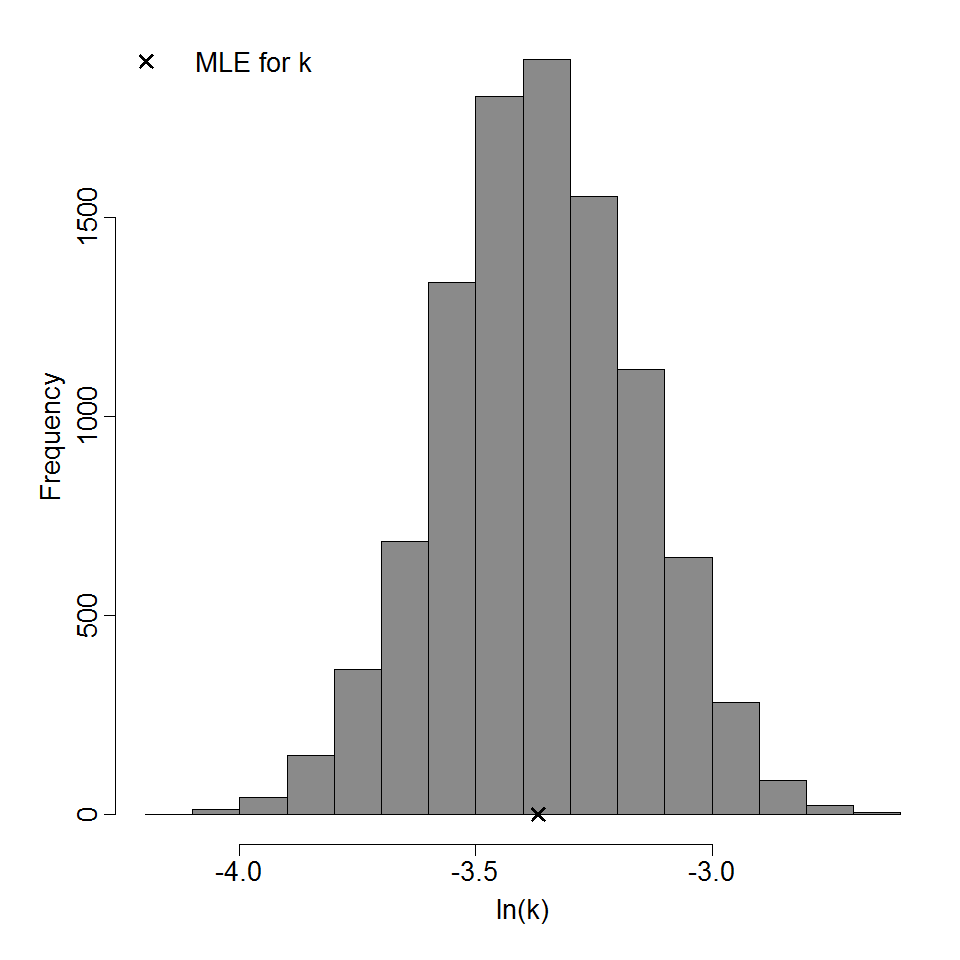
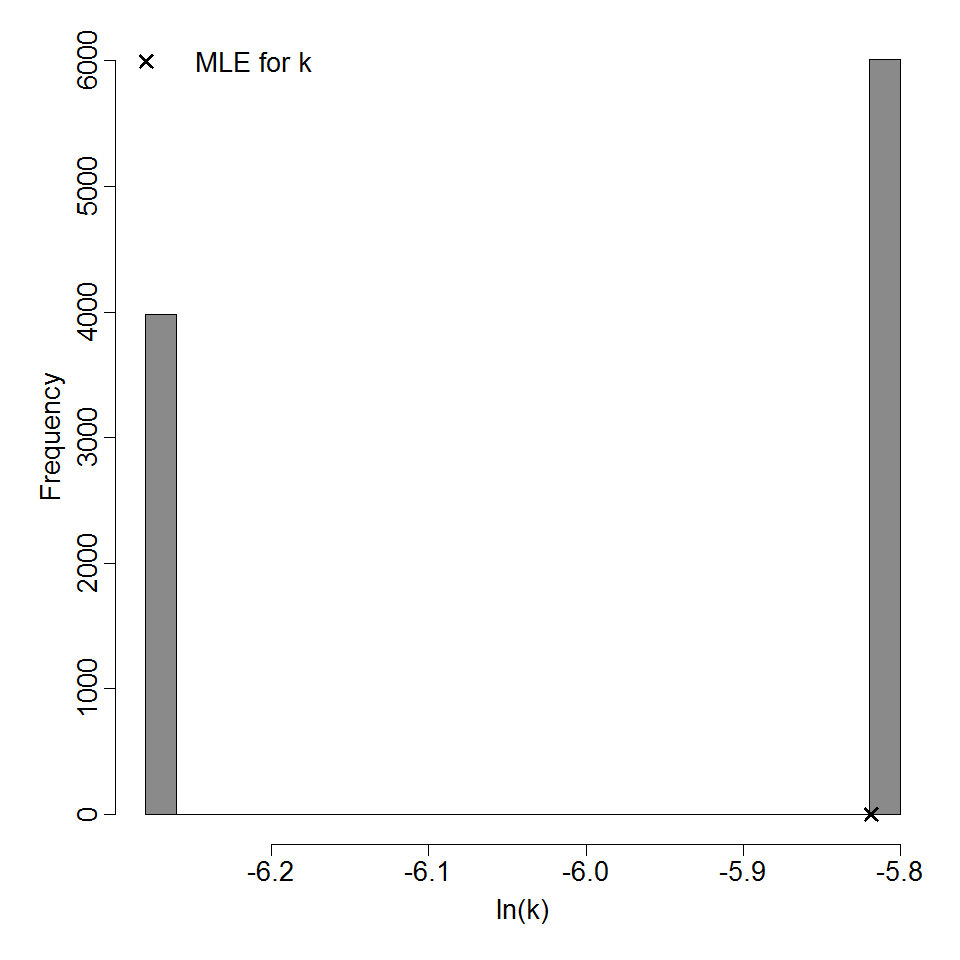
Parameter histogram for exponential model (uncertainty of the parameter)
Exponential model plot, with confidence bounds around optimized model
# of Doses
5.00
Μodel
LD50/ID50
2.01E+01
Dose Units
Response
Exposure Route
Contains Preferred Model
k
3.45E-02
Agent Strain
CO92
Experiment ID
3
Host type
Description
|
|
||||||||||||||||||||||
|
||||||||||||||||||||||||||||||||||||||

Parameter histogram for exponential model (uncertainty of the parameter)
Exponential model plot, with confidence bounds around optimized model
# of Doses
6.00
Μodel
LD50/ID50
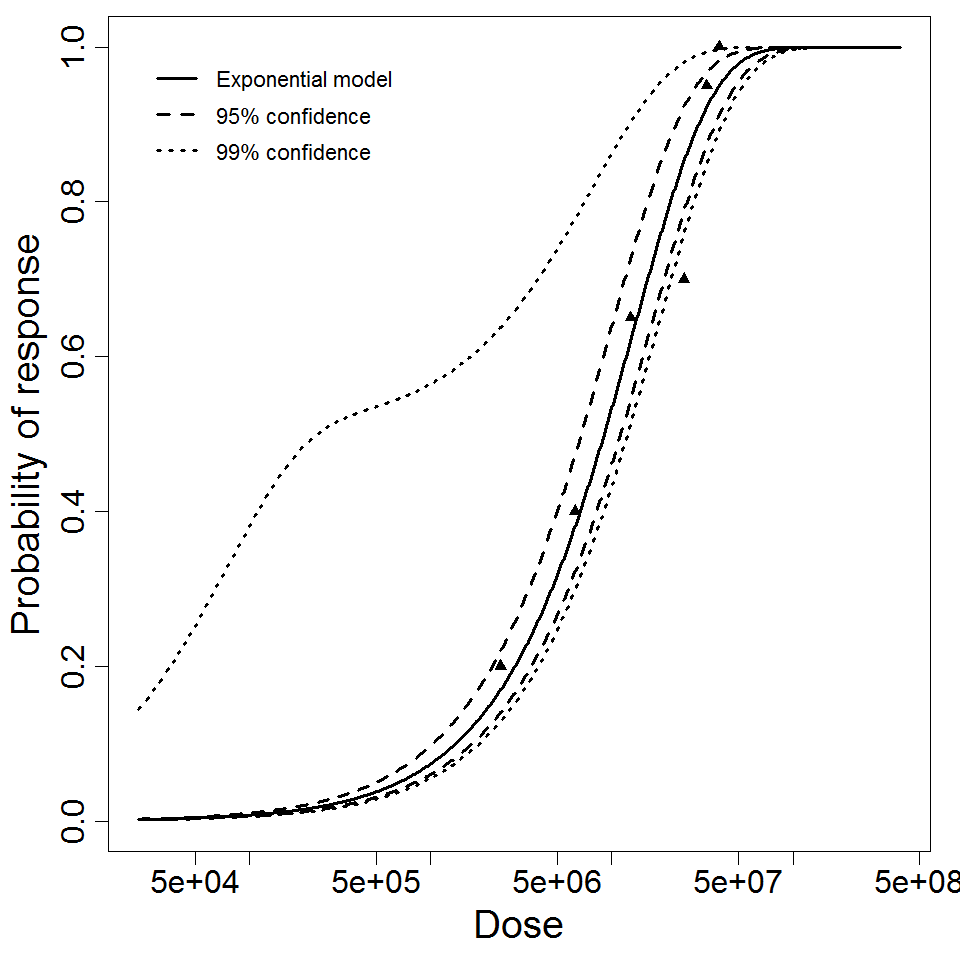
9.08E+06
Dose Units
Response
Exposure Route
Contains Preferred Model
k
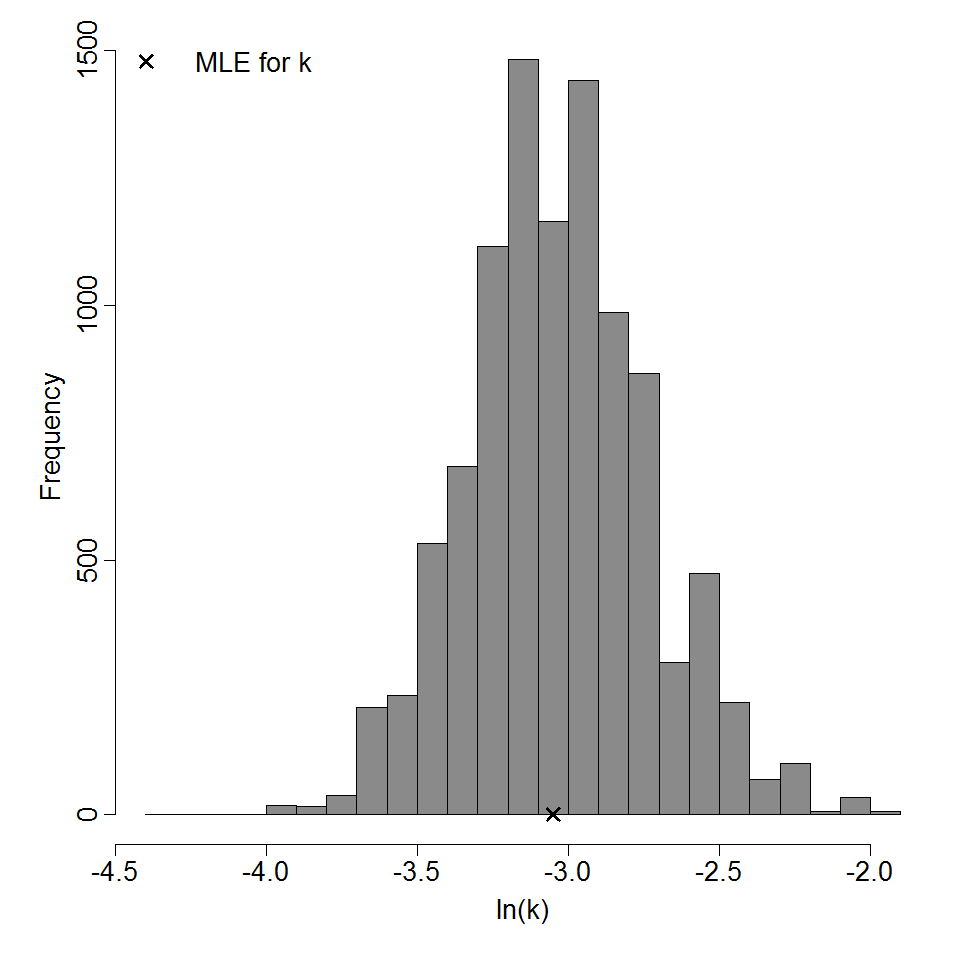
7.64E-08
Experiment ID
278
Host type
Description
|
|
||||||||||||||||||||||
|
||||||||||||||||||||||||||||||||||||||

Parameter histogram for exponential model (uncertainty of the parameter)

Exponential model plot, with confidence bounds around optimized model
# of Doses
5.00
Μodel
LD50/ID50
5.22E+06
Dose Units
Response
Exposure Route
Contains Preferred Model
k
1.33E-07
Agent Strain
Aa strain
Experiment ID
275
Host type
Description
Optimization Output for experiment 274
|
|
||||||||||||||||||||||
|
||||||||||||||||||||||||||||||||||||||
Parameter histogram for exponential model (uncertainty of the parameter)
Exponential model plot, with confidence bounds around optimized model
# of Doses
4.00
Μodel
LD50/ID50
1.46E+01
Dose Units
Response
Exposure Route
Contains Preferred Model
k
4.73E-02
Agent Strain
SCHU S-4
Experiment ID
274
Host type
Description
|
|
||||||||||||||||||||||
|
||||||||||||||||||||||||||||||||||||||
Parameter histogram for Exponential model (uncertainty of the parameter)

Exponential model plot, with confidence bounds around optimized model
# of Doses
3.00
Μodel
LD50/ID50
1000
Dose Units
Response
Exposure Route
Contains Preferred Model
k
6.93E-04
Agent Strain
sub sp. Paratuberculosis Bovine
Experiment ID
262
Host type
Description
|
|
||||||||||||||||||||||
|
||||||||||||||||||||||||||||||||||||||

Parameter histogram for exponential model (uncertainty of the parameter)

Exponential model plot, with confidence bounds around optimized model
# of Doses
4.00
Μodel
LD50/ID50
3.24E+02
Dose Units
Response
Exposure Route
Contains Preferred Model
k
2.14E-03
Agent Strain
MHV-1
Experiment ID
261
Host type
Description
|
|
||||||||||||||||||||||
|
||||||||||||||||||||||||||||||||||||||
Parameter histogram for exponential model (uncertainty of the parameter)
Exponential model plot, with confidence bounds around optimized model
# of Doses
0.00
Μodel
LD50/ID50
2.82E+02
Dose Units
Response
Exposure Route
Contains Preferred Model
k
2.46E-03
Agent Strain
rSARS-CoV
Experiment ID
260, 261
Host type
Description
|
|
||||||||||||||||||||||
|
||||||||||||||||||||||||||||||||||||||
Parameter histogram for exponential model (uncertainty of the parameter)
Exponential model plot, with confidence bounds around optimized model
# of Doses
4.00
Μodel
LD50/ID50
2.33E+02
Dose Units
Response
Exposure Route
Contains Preferred Model
k
2.97E-03
Agent Strain
rSARS-CoV
Experiment ID
260
Host type
Description
|
||||||||||||||||||||||
|
||||||||||||||||||||||||||||||||||||||

Parameter histogram for exponential model (uncertainty of the parameter)

Exponential model plot, with confidence bounds around optimized model
# of Doses
13.00
Μodel
LD50/ID50
1.22E+10
Dose Units
Response
Exposure Route
Contains Preferred Model
k
5.7E-11
Agent Strain
Nine mile phase I
Experiment ID
26
Host type