\[P(response)=1-exp(-k\times dose)\]
Description
| ||||||||||||||||||||||
| Model | Deviance | Δ | DF | χ20.95,df | χ20.95,1 | Good fit? | Parameters | LD50 |
|---|---|---|---|---|---|---|---|---|
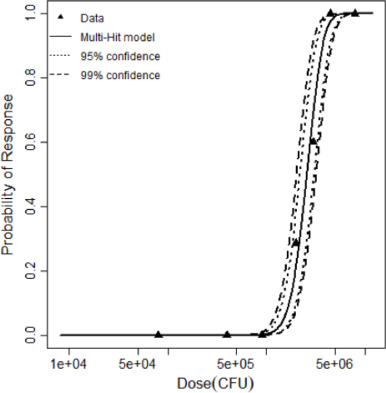
| Multi-hit | 1.09 | 15.69 | 5 | 11.1 | 3.84 | Yes | k = 4.12 × 10⁻⁶ kmin=11 | 2,588,047 |
# of Doses
7.00
Μodel
Dose Units
Response
Exposure Route
Contains Preferred Model
Status
fitted
k
3.22E-7
Agent Strain
PA01
Experiment ID
Ojielo2003
Host type
Experiment Dataset
| Dose (CFU) | Positive Response | Negative Response |
|---|---|---|
| 80000 | 0 | 10 |
| 400000 | 0 | 10 |
| 900000 | 0 | 10 |
| 2000000 | 2 | 5 |
| 3000000 | 6 | 4 |
| 4500000 | 10 | 0 |
| 8000000 | 10 | 0 |
Description
|
|
||||||||||||||||||||||
|
||||||||||||||||||||||||||||||||||||||
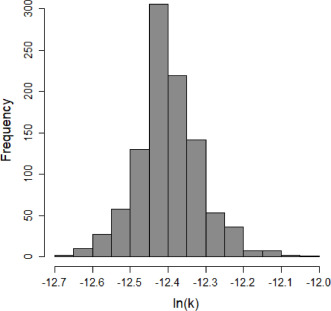
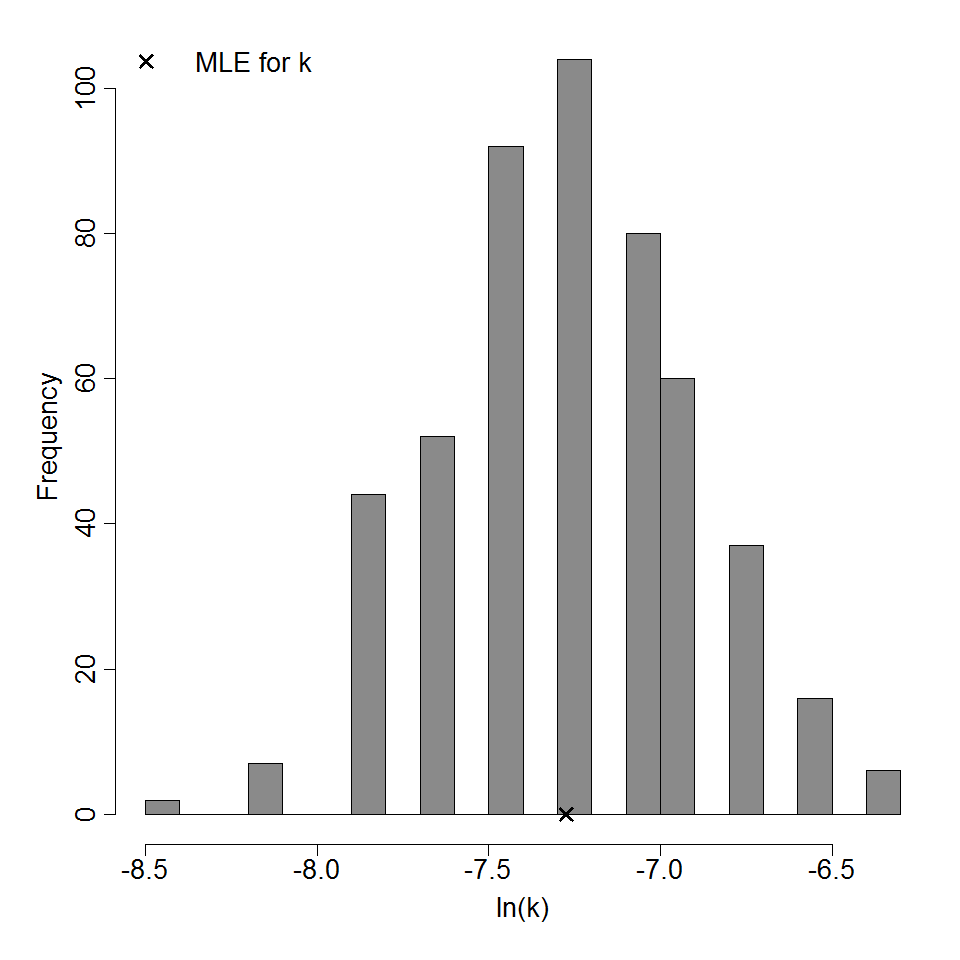
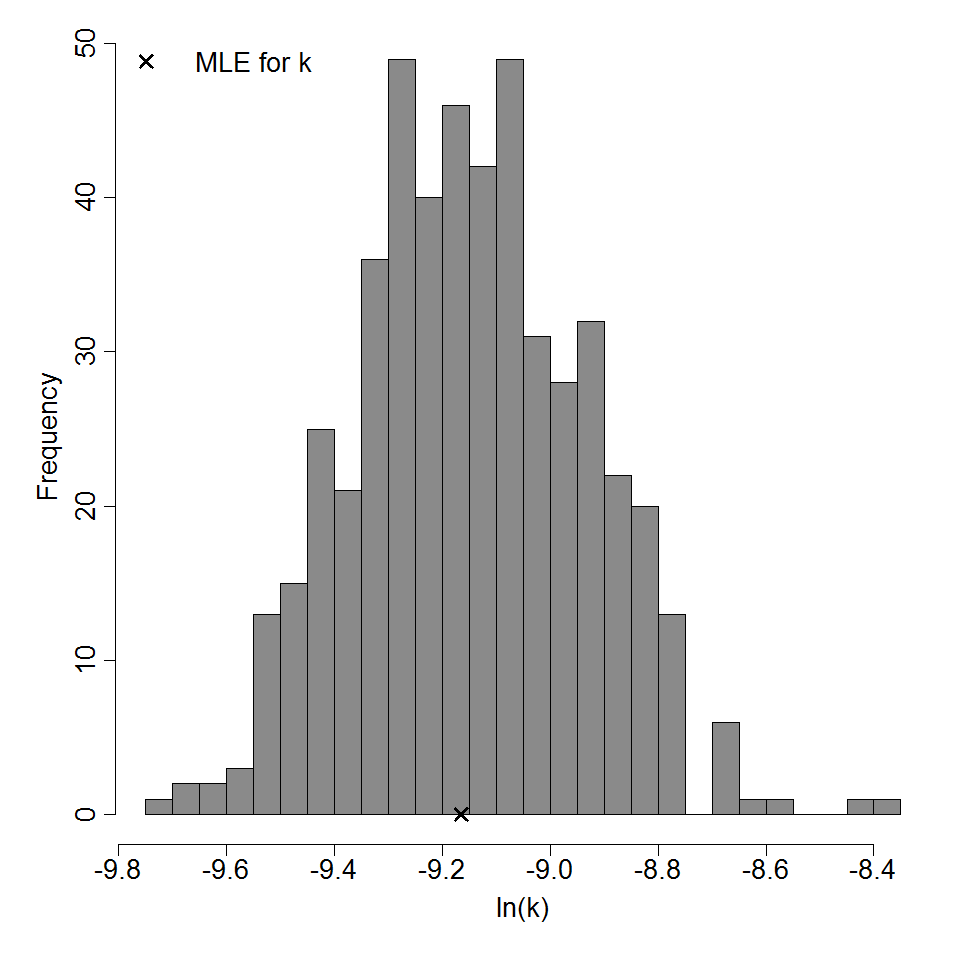
Parameter histogram for exponential model (uncertainty of the parameter)
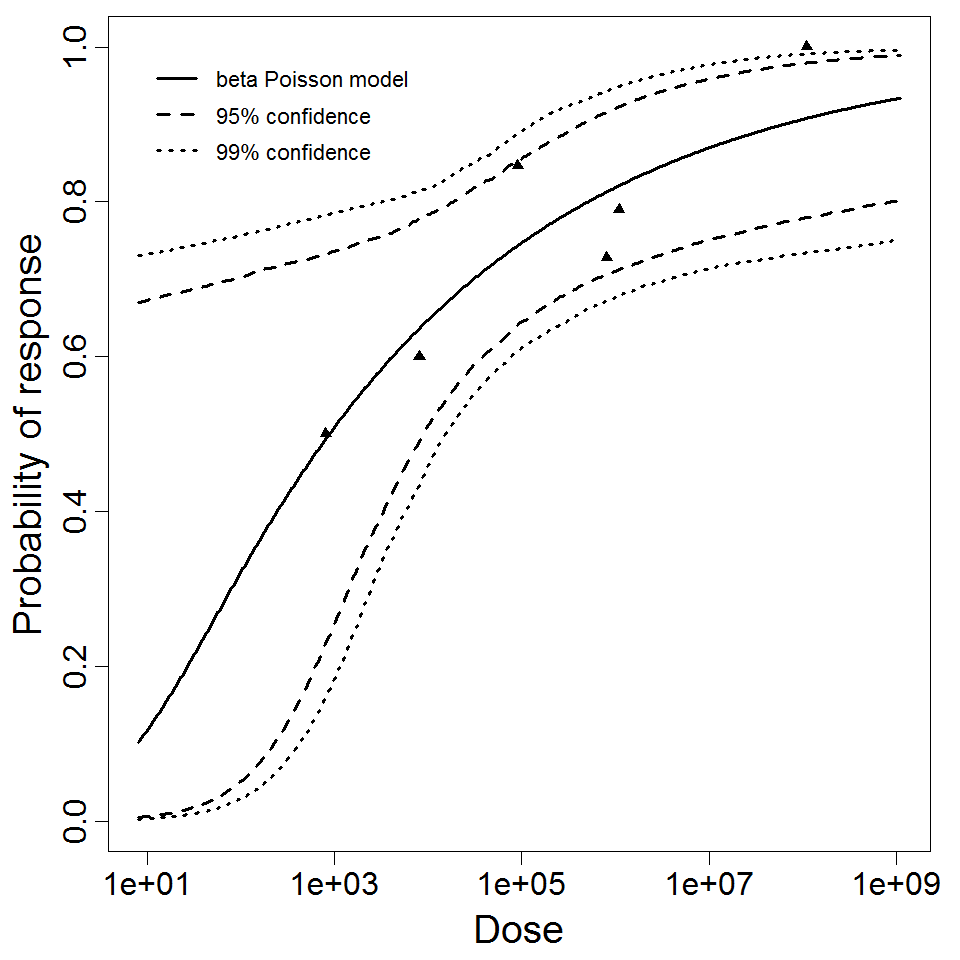
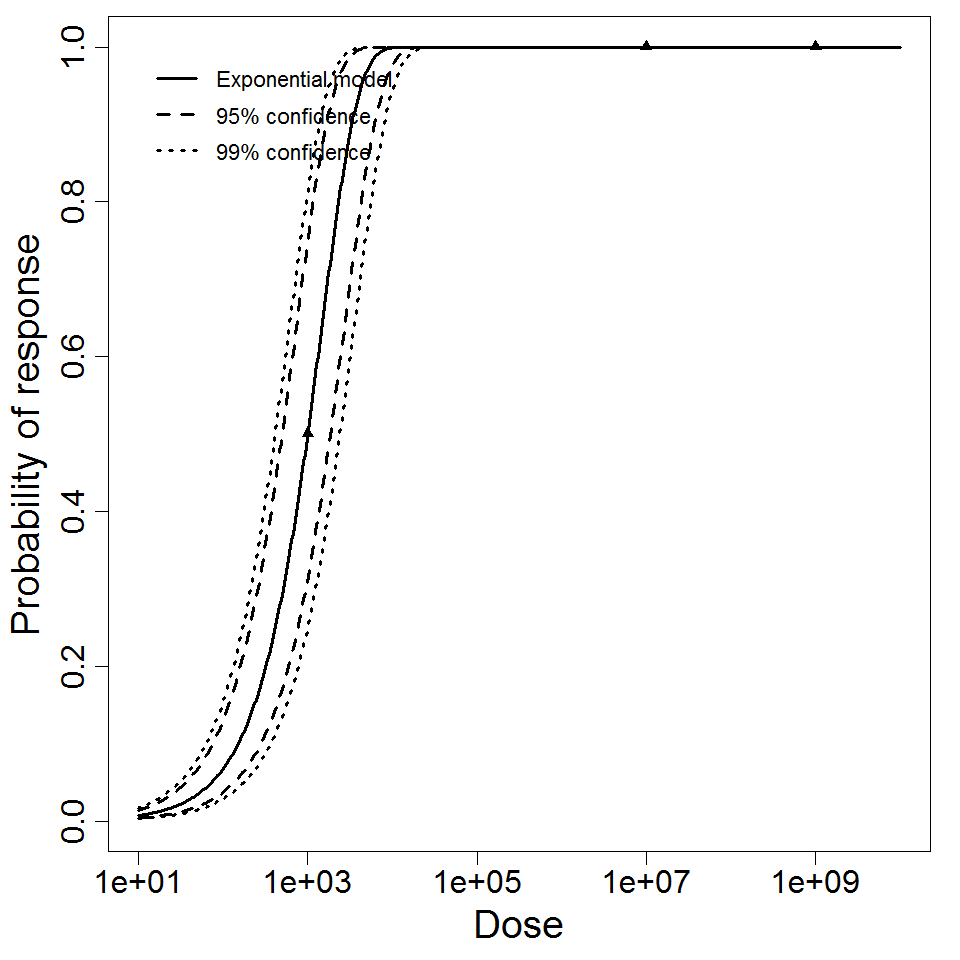
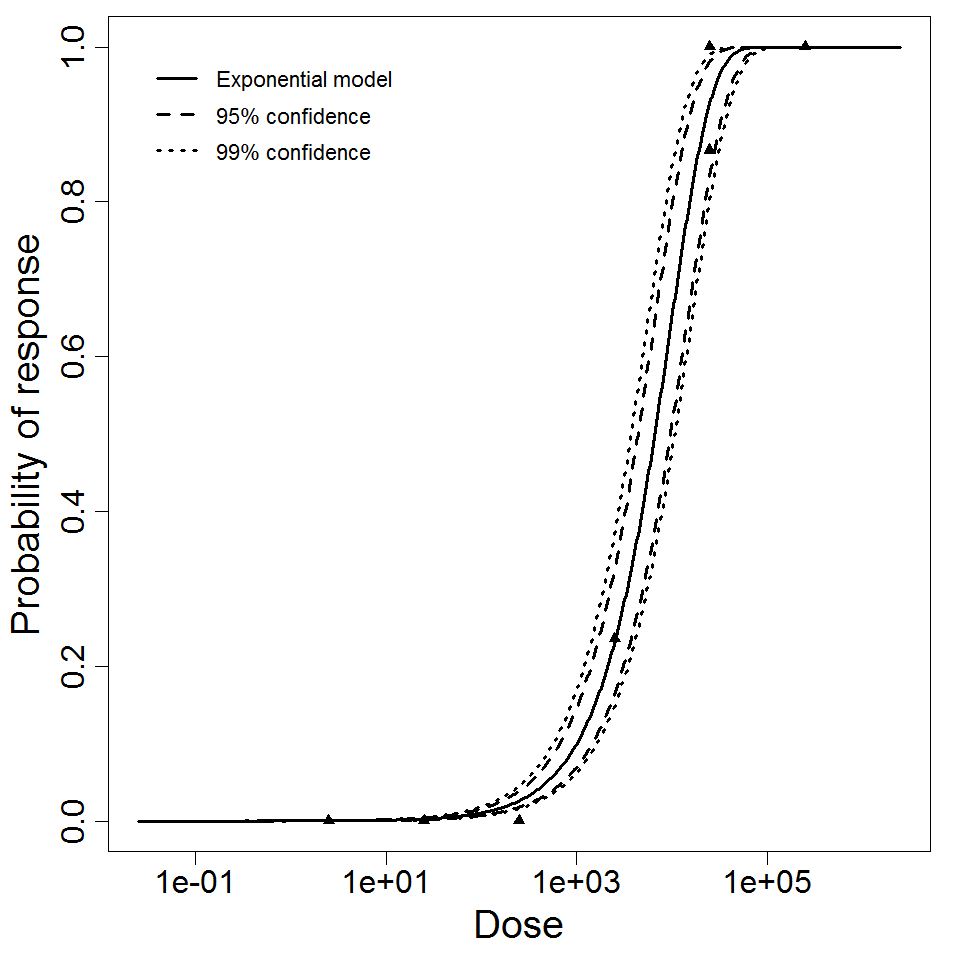
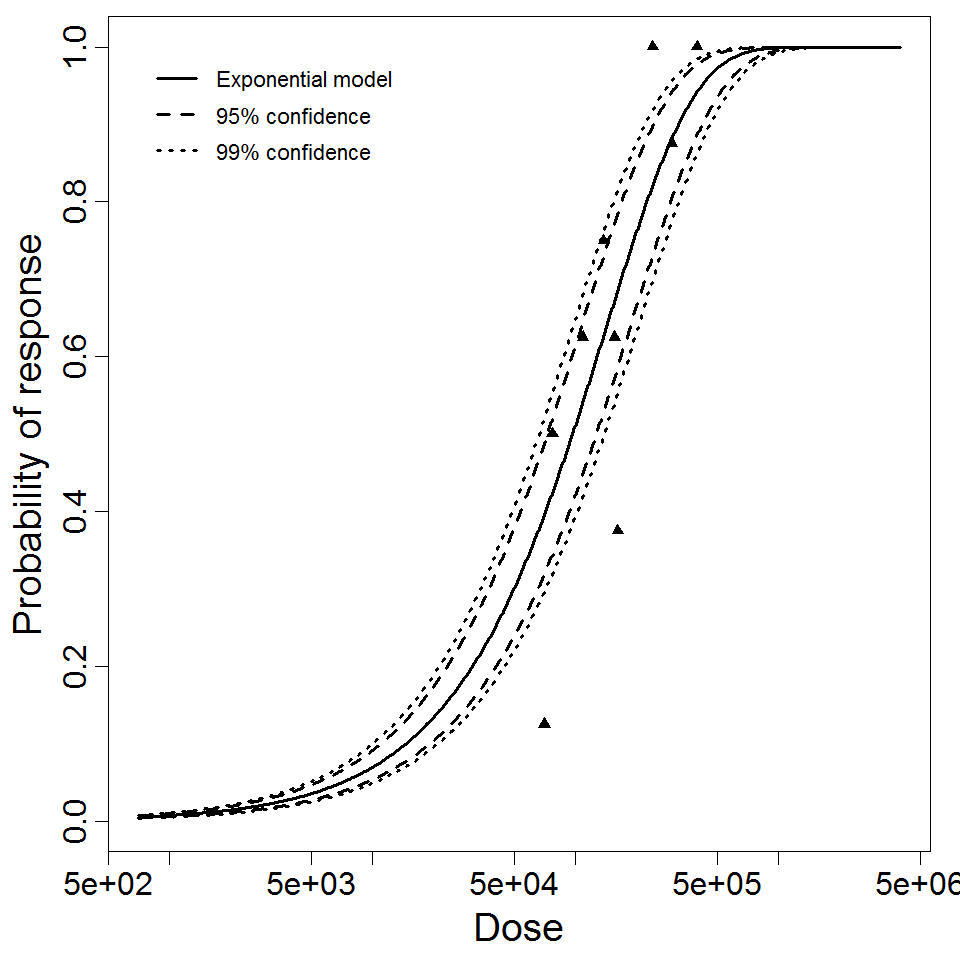
Exponential model plot, with confidence bounds around optimized model
# of Doses
5.00
Μodel
LD50/ID50
7.69E+05
Dose Units
Response
Exposure Route
Contains Preferred Model
k
9.01E-07
Agent Strain
type strain for serotype PEN 1
Experiment ID
184
Host type
Description
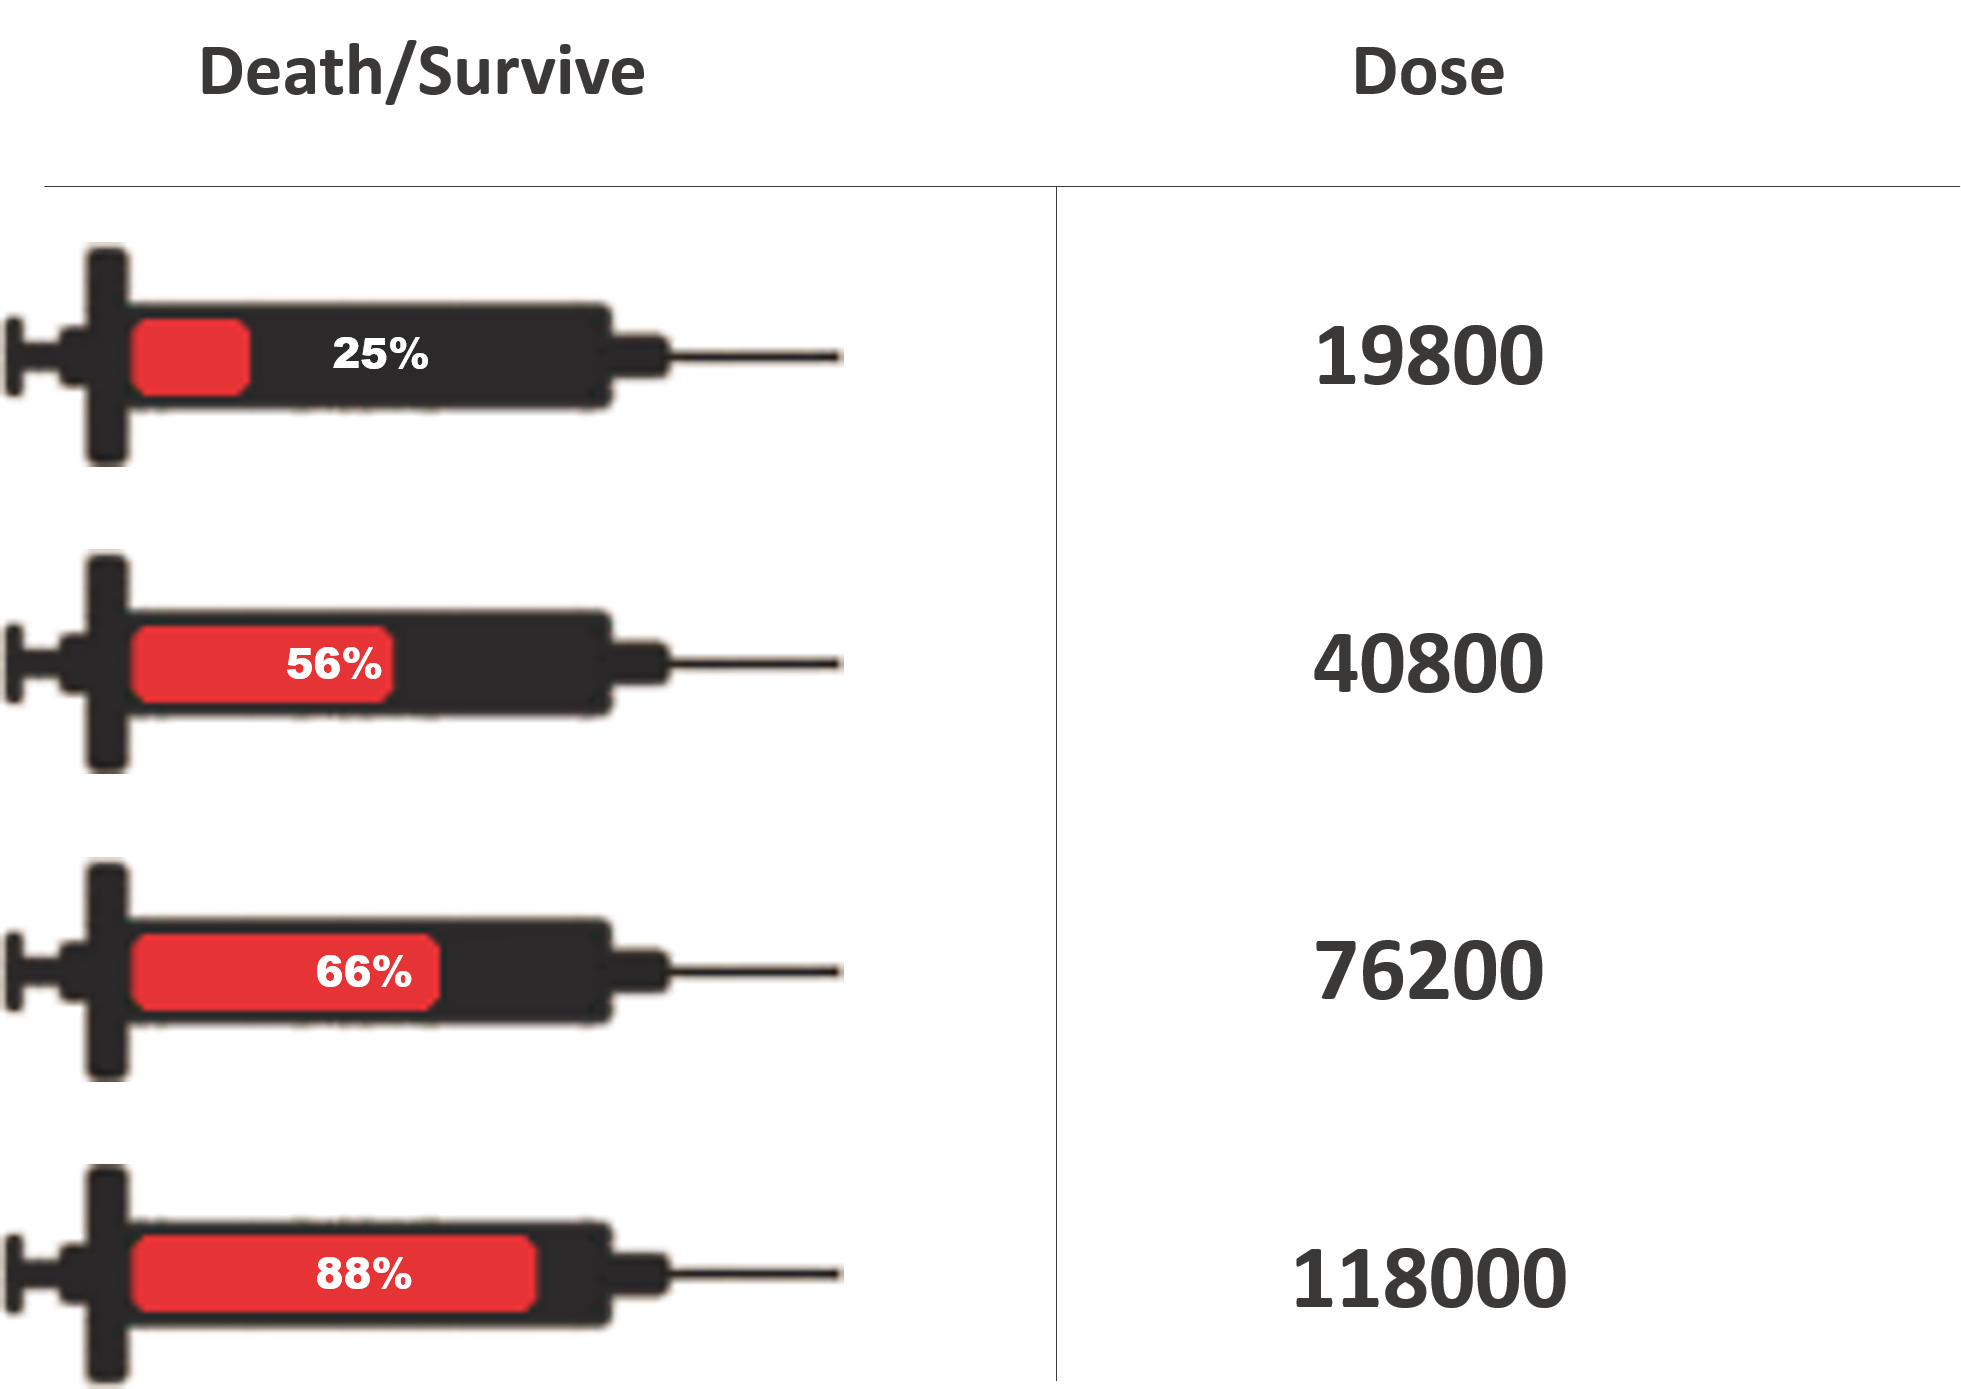
Badenoch et al. (1990) studied the combined effect of Acanthamoeba Ac118 (a group III isolate) and the bacterium Corynebacterium xerosis on the corneas of female Porton rats. A constant dose of 104 C. xerosis with increasing doses of Acanthamoeba spp. were injected into incisions in the rat corneas using a microsyringe (Badenoch et al. 1990).
The exponential model provided the best fit to the data.


# of Doses
4.00
Μodel
LD50/ID50
6,886
Dose Units
Response
Exposure Route
Contains Preferred Model
Status
fitted
Resampled Parameters
k
1.01E-04
Agent Strain
Acanthamoeba Ac118
Experiment ID
Acanth_Cornea1
Host type
Experiment Dataset
| Dose (no. of organisms) | Positive Responses | Negative Responses | Total Subjects/Responses | |
|---|---|---|---|---|
| 10 | 0 | 8 | 8 | |
| 100 | 0 | 16 | 16 | |
| 1000 | 2 | 16 | 18 | |
| 10000 | 5 | 3 | 8 |
Description
|
|
||||||||||||||||||||||
|
||||||||||||||||||||||||||||||||||||||
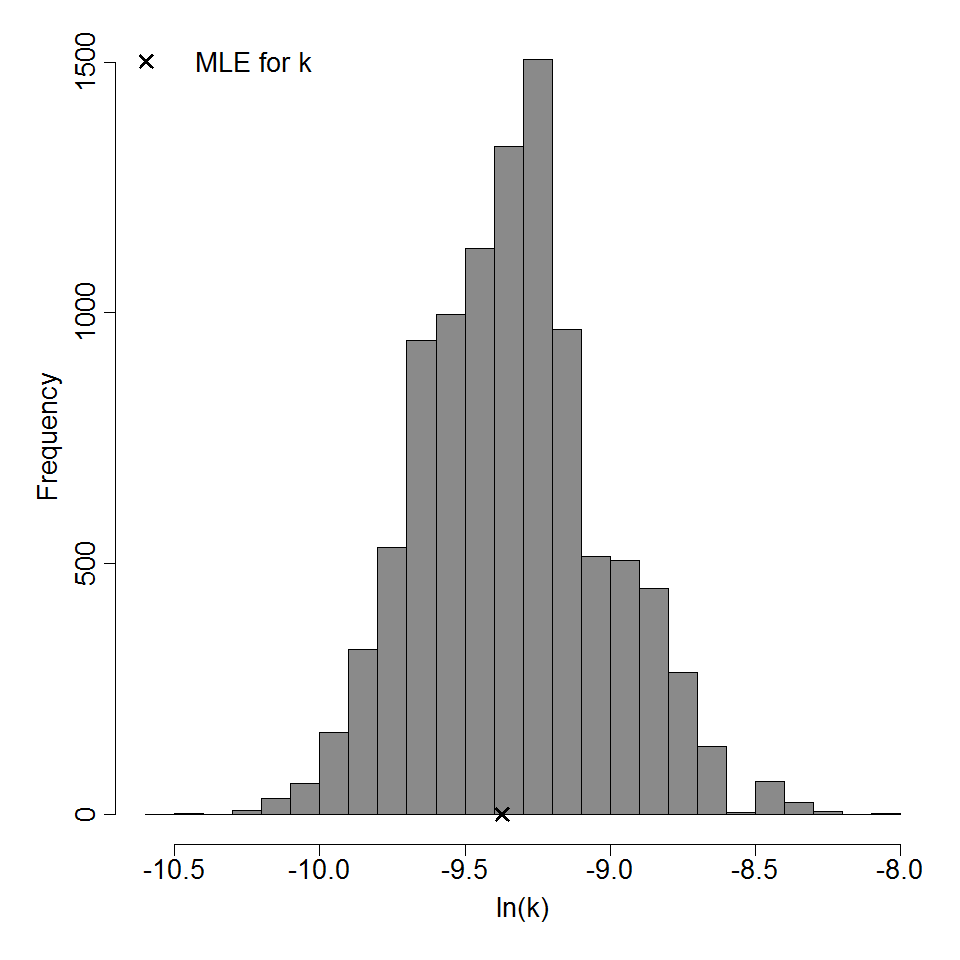
Parameter histogram for exponential model (uncertainty of the parameter)
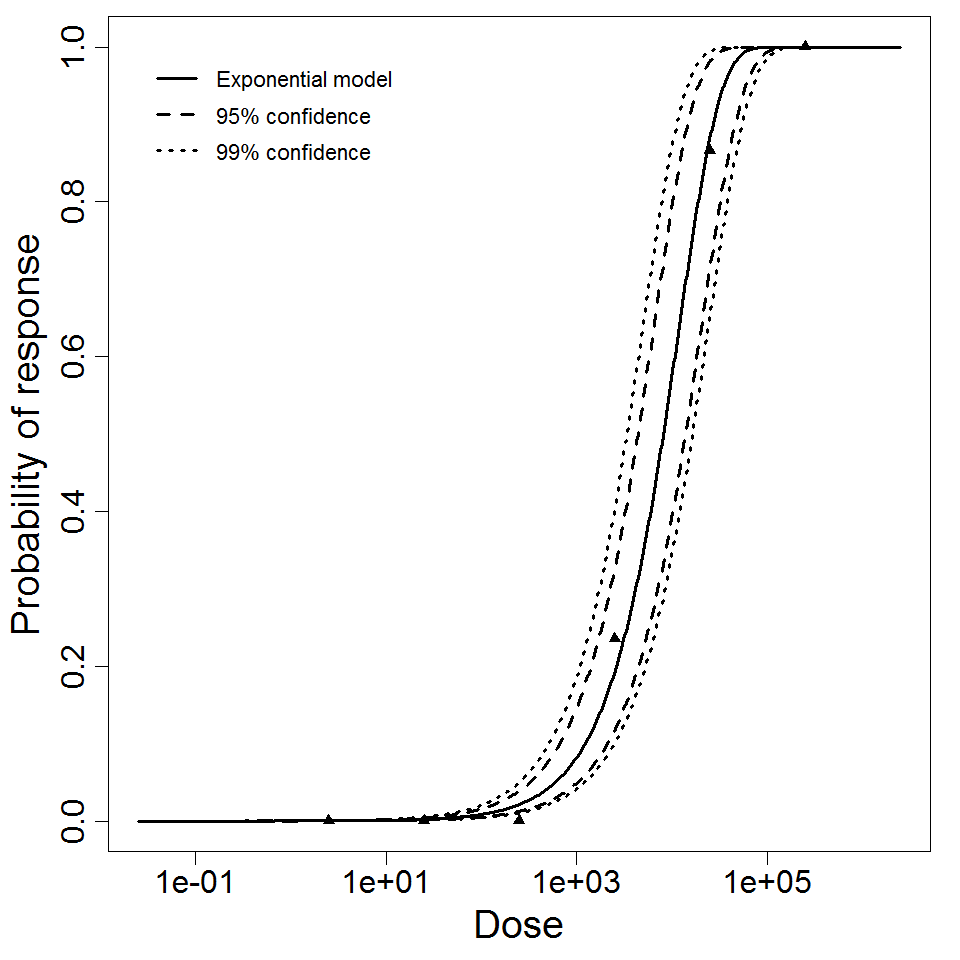
Exponential model plot, with confidence bounds around optimized model
# of Doses
6.00
Μodel
LD50/ID50
4.98E+03
Dose Units
Response
Exposure Route
Contains Preferred Model
k
1.39E-04
Agent Strain
ATCC 19660
Experiment ID
282
Host type
Description
|
|
||||||||||||||||||||||
|
||||||||||||||||||||||||||||||||||||||
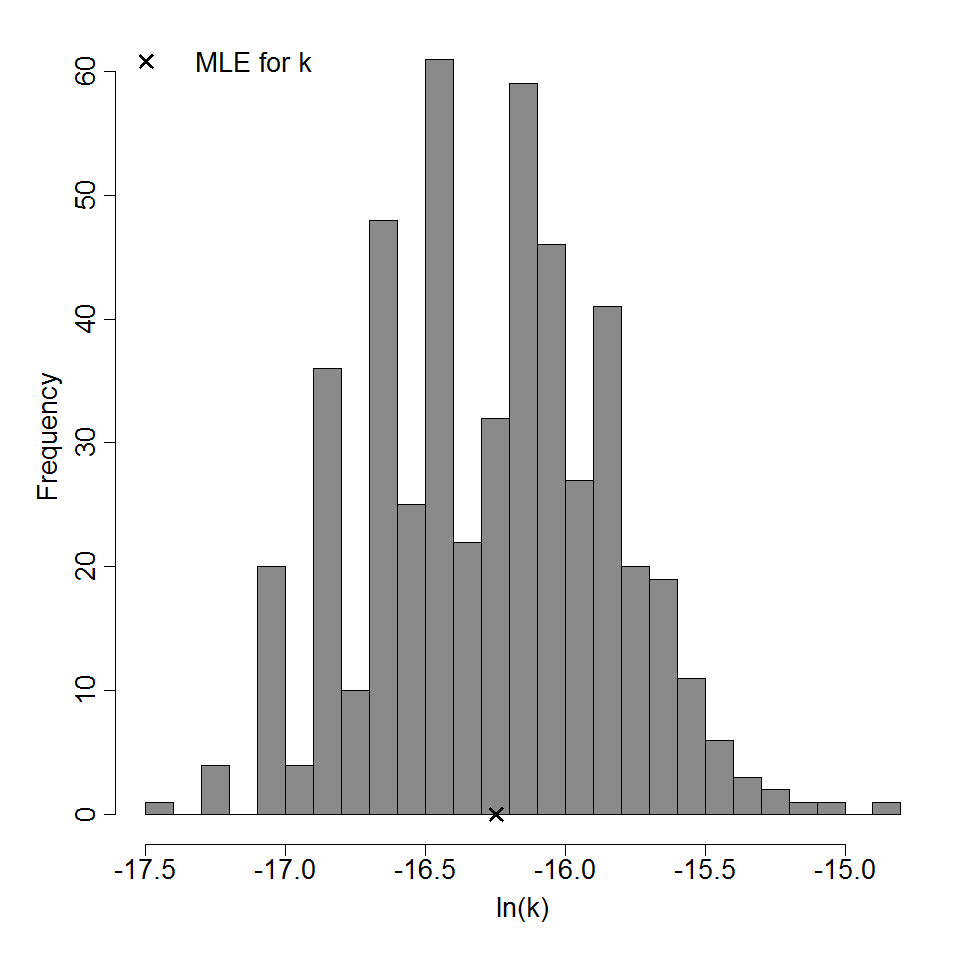
Parameter histogram for exponential model (uncertainty of the parameter)
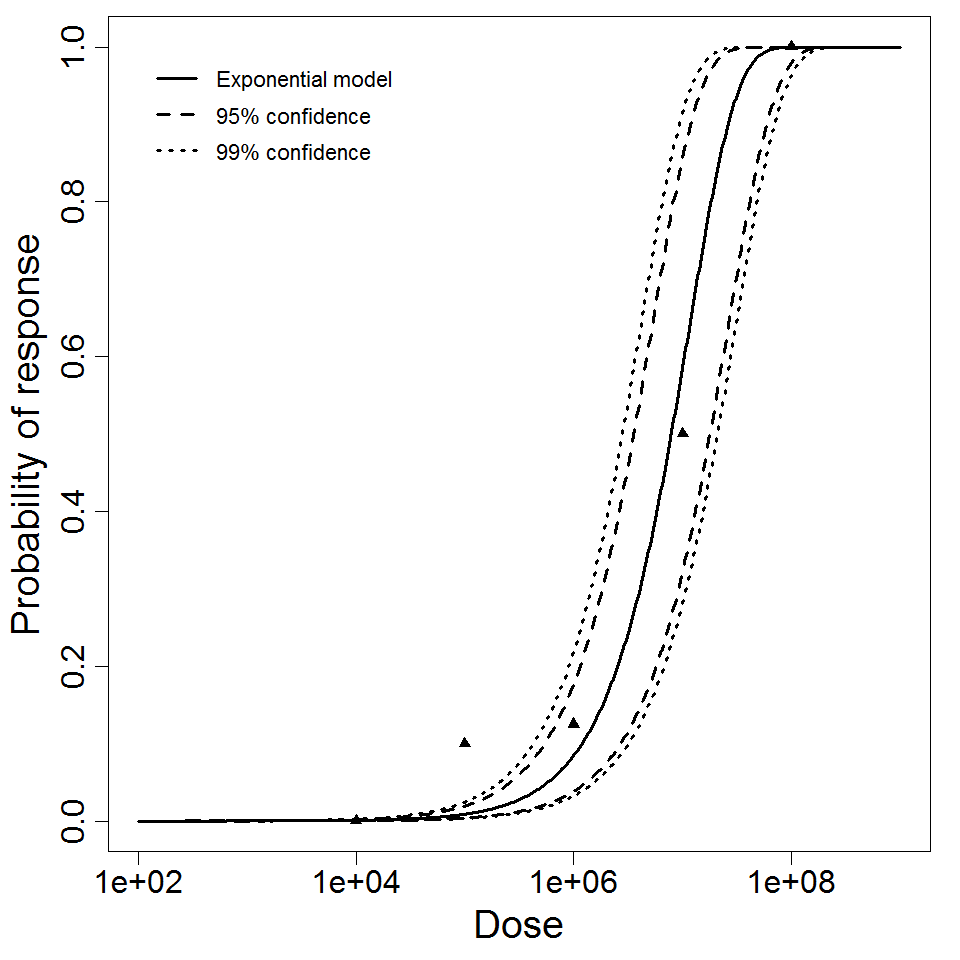
Exponential model plot, with confidence bounds around optimized model
# of Doses
6.00
Μodel
LD50/ID50
8.13E+03
Dose Units
Response
Exposure Route
Contains Preferred Model
k
8.52E-05
Agent Strain
ATCC 19660
Experiment ID
281
Host type
Description
|
|
||||||||||||||||||||||
|
||||||||||||||||||||||||||||||||||||||
Parameter histogram for exponential model (uncertainty of the parameter)
Exponential model plot, with confidence bounds around optimized model
# of Doses
12.00
Μodel
LD50/ID50
6.61E+03
Dose Units
Response
Exposure Route
Contains Preferred Model
k
1.05E-04
Agent Strain
ATCC 19660
Experiment ID
281,282 (pooled)
Host type
Description
|
|
||||||||||||||||||||||
|
||||||||||||||||||||||||||||||||||||||
Parameter histogram for exponential model (uncertainty of the parameter)
Exponential model plot, with confidence bounds around optimized model
# of Doses
5.00
Μodel
LD50/ID50
7.88E+06
Dose Units
Response
Exposure Route
Contains Preferred Model
k
8.8E-08
Agent Strain
ATCC 19660
Experiment ID
286
Host type
Description
|
||||||||||||||||||||||
|
||||||||||||||||||||||||||||||||||||||
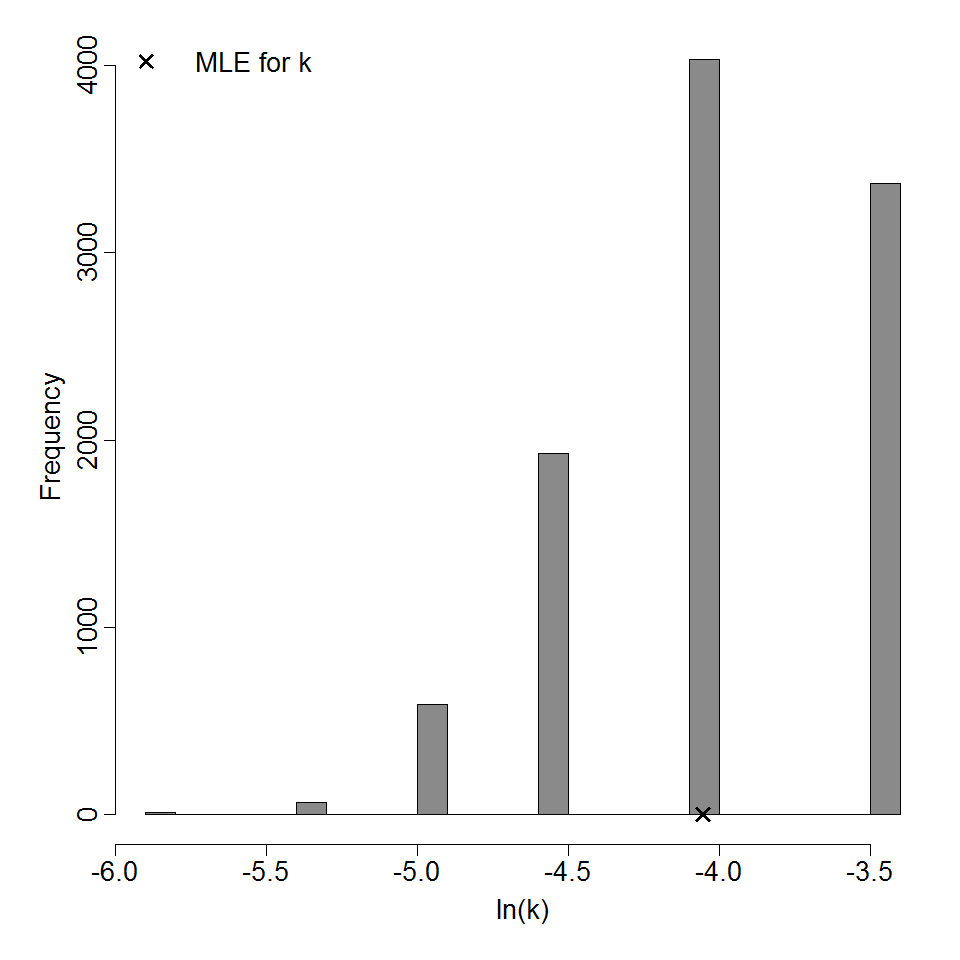
Parameter histogram for exponential model (uncertainty of the parameter)
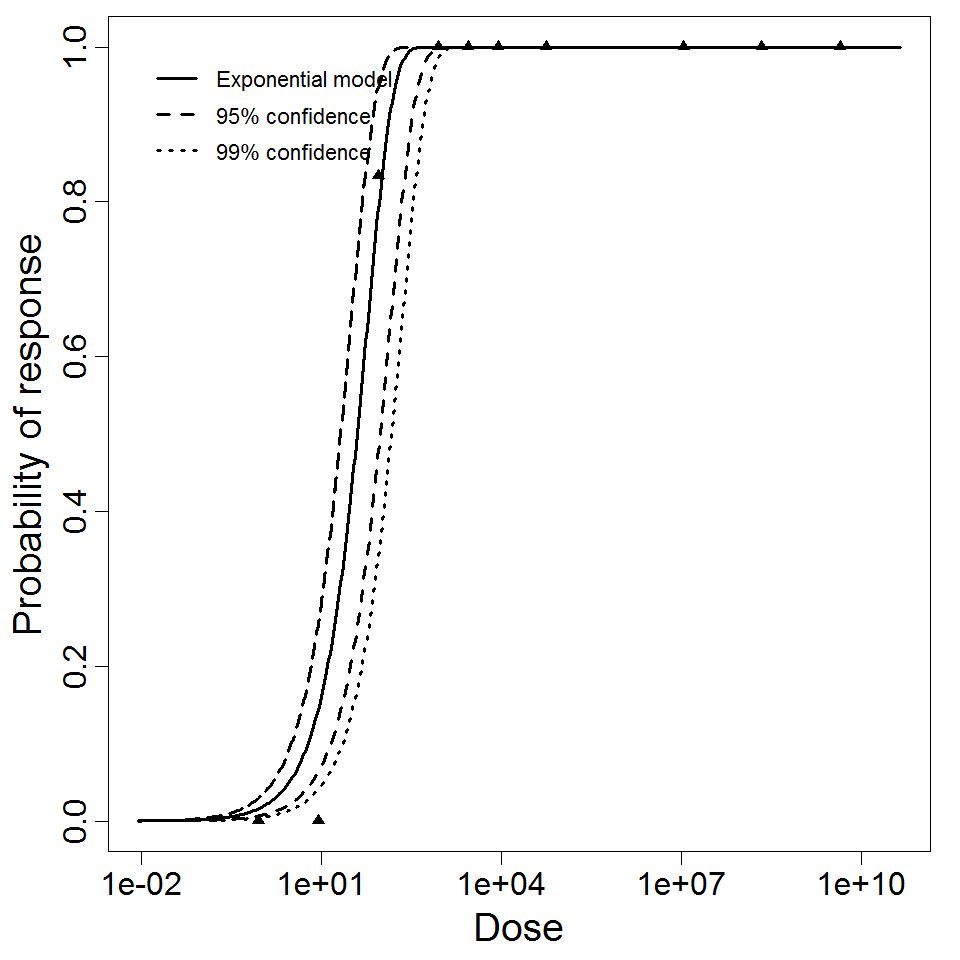
Exponential model plot, with confidence bounds around optimized model
# of Doses
10.00
Μodel
LD50/ID50
4E+01
Dose Units
Response
Exposure Route
Contains Preferred Model
k
1.73E-02
Agent Strain
OSU (ATCC VR892)
Experiment ID
68
Host type
Description
|
|
||||||||||||||||||||||
|
||||||||||||||||||||||||||||||||||||||

Parameter histogram for exponential model (uncertainty of the parameter)
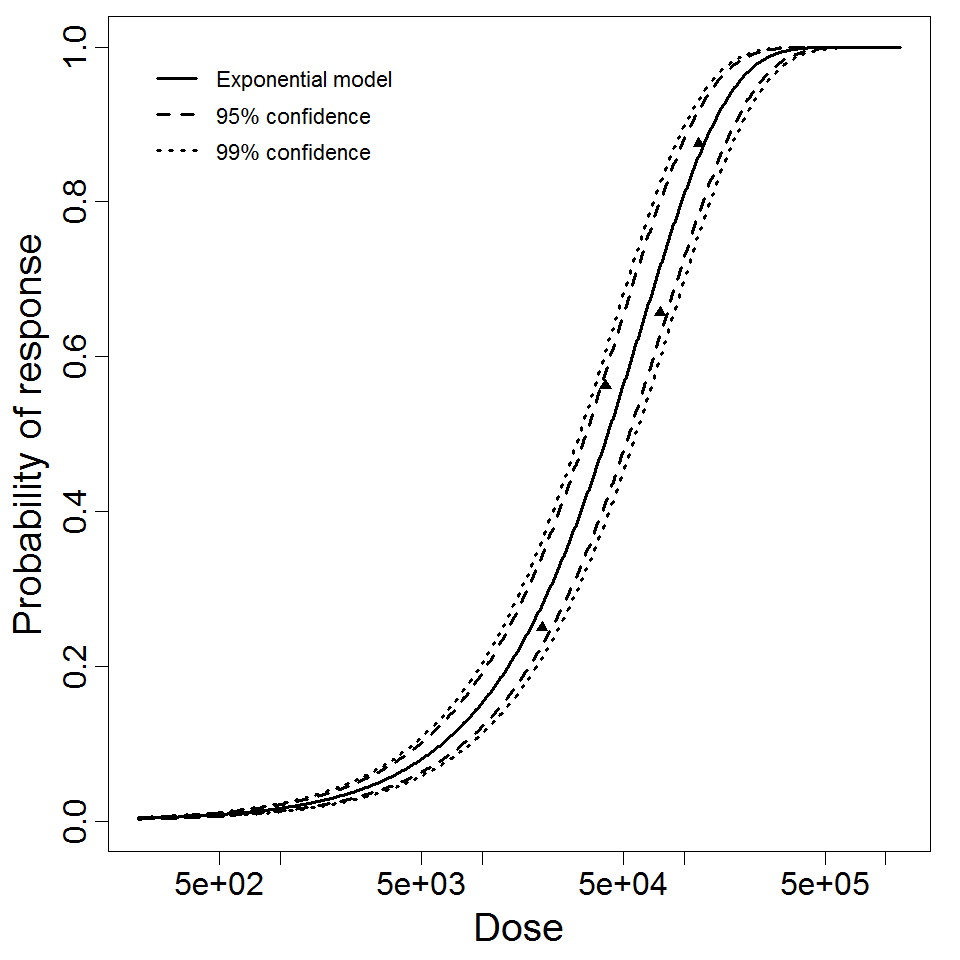
Exponential model plot, with confidence bounds around optimized model
# of Doses
4.00
Μodel
LD50/ID50
4.2E+04
Dose Units
Response
Exposure Route
Contains Preferred Model
k
1.65E-05
Agent Strain
Vollum
Experiment ID
87
Host type
Description
|
|
||||||||||||||||||||||
|
||||||||||||||||||||||||||||||||||||||

Parameter histogram for exponential model (uncertainty of the parameter)
Exponential model plot, with confidence bounds around optimized model
# of Doses
9.00
Μodel
LD50/ID50
9.69E+04
Dose Units
Response
Exposure Route
Contains Preferred Model
k
7.16E-06
Agent Strain
Vollum
Experiment ID
86
Host type