Description
|
|
||||||||||||||||||||||
|
||||||||||||||||||||||||||||||
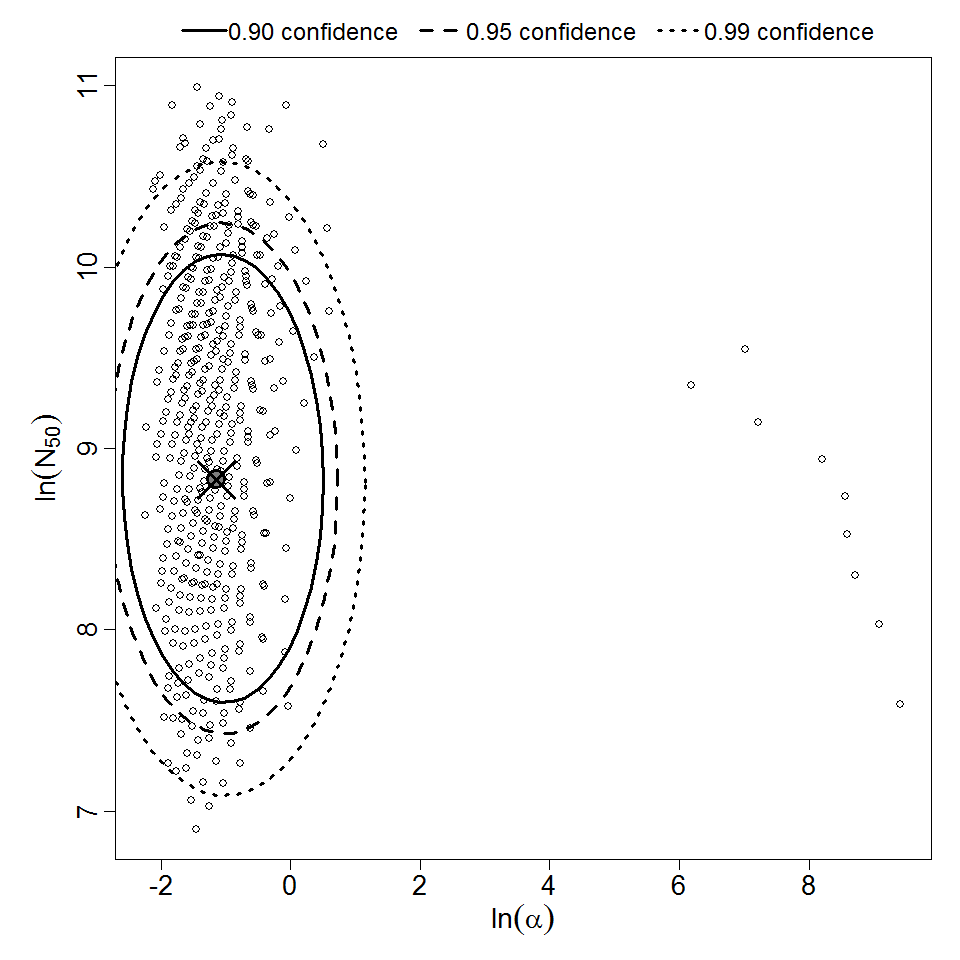
Parameter scatter plot for beta Poisson model ellipses signify the 0.9, 0.95 and 0.99 confidence of the parameters.

beta Poisson model plot, with confidence bounds around optimized model
# of Doses
6.00
Μodel
N50
6.82E+03
LD50/ID50
6.82E+03
Dose Units
Response
Exposure Route
Contains Preferred Model
a
3.18E-01
Agent Strain
Inaba 569B
Experiment ID
126
Host type
Description
|
|
||||||||||||||||||||||
|
||||||||||||||||||||||||||||||
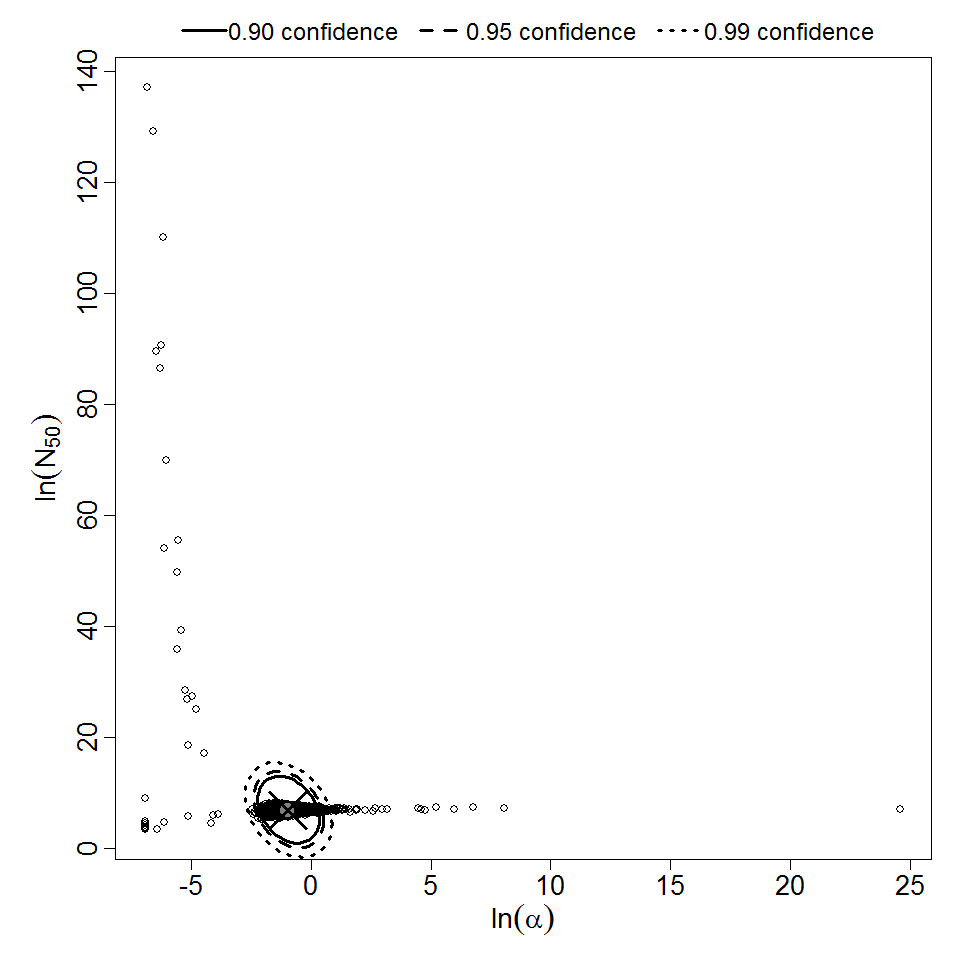
Parameter scatter plot for beta Poisson model ellipses signify the 0.9, 0.95 and 0.99 confidence of the parameters.
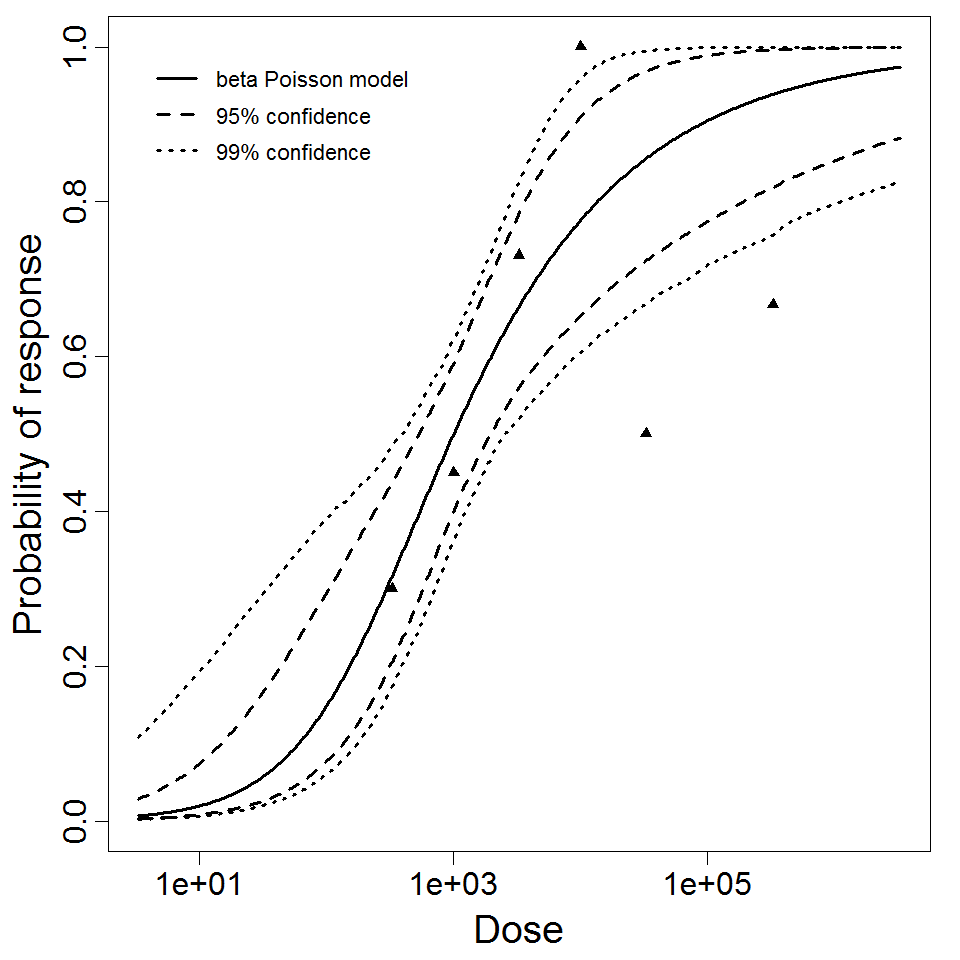
beta Poisson model plot, with confidence bounds around optimized model
# of Doses
6.00
Μodel
N50
1.01E+03
LD50/ID50
1.01E+03
Dose Units
Response
Exposure Route
Contains Preferred Model
a
3.74E-01
Agent Strain
strain 12
Experiment ID
112
Host type
Description
|
| ||||||||||||||||||||||
| ||||||||||||||||||||||||||||||||||||||

# of Doses
8.00
Μodel
LD50/ID50
1.65E+02
Dose Units
Response
Exposure Route
Contains Preferred Model
k
4.19E-03
Agent Strain
Iowa strain
Experiment ID
108
Host type
Experiment Dataset
Description
|
| ||||||||||||||||||||||
| ||||||||||||||||||||||||||||||||||||||
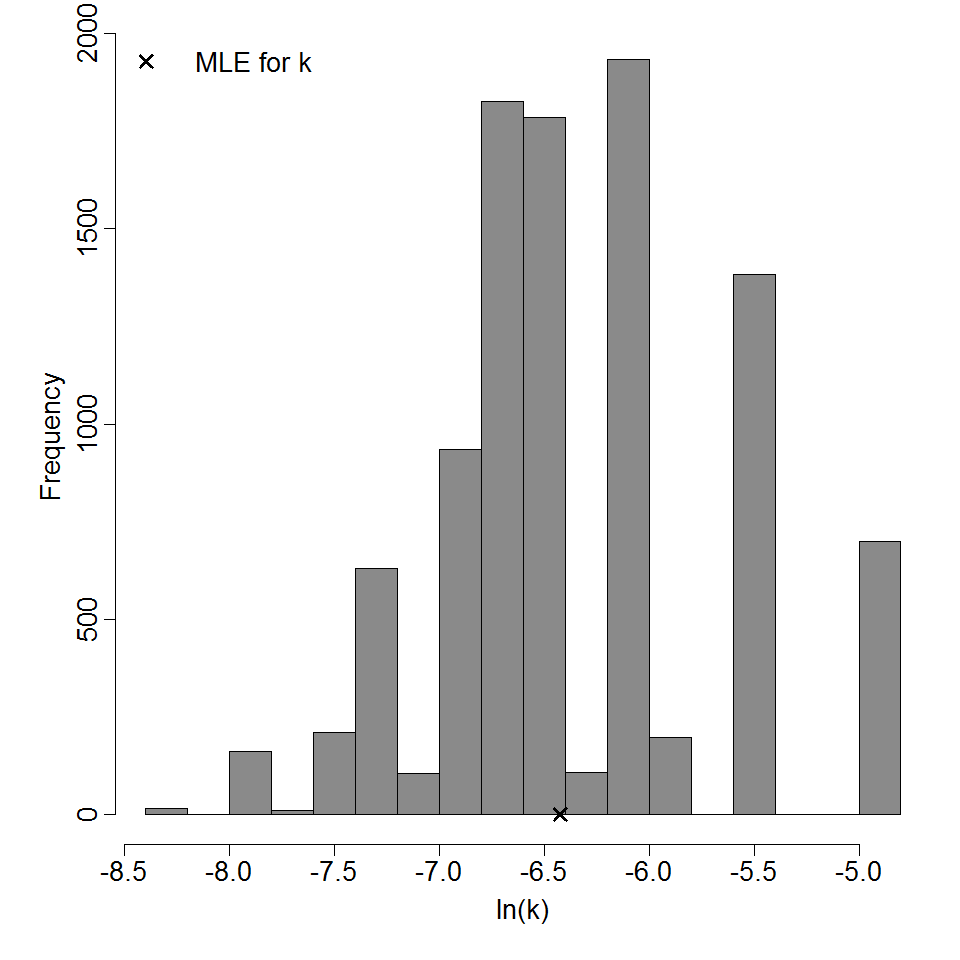
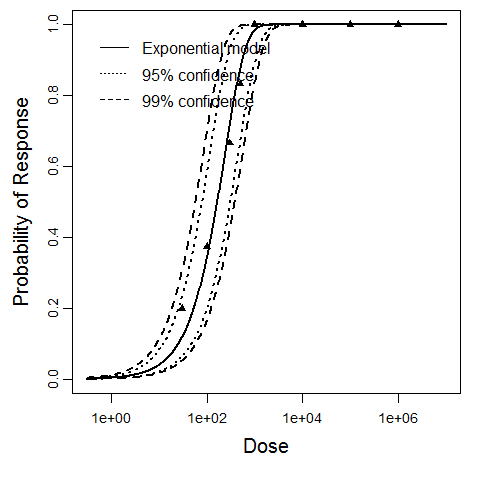
Parameter histogram for exponential model (uncertainty of the parameter)
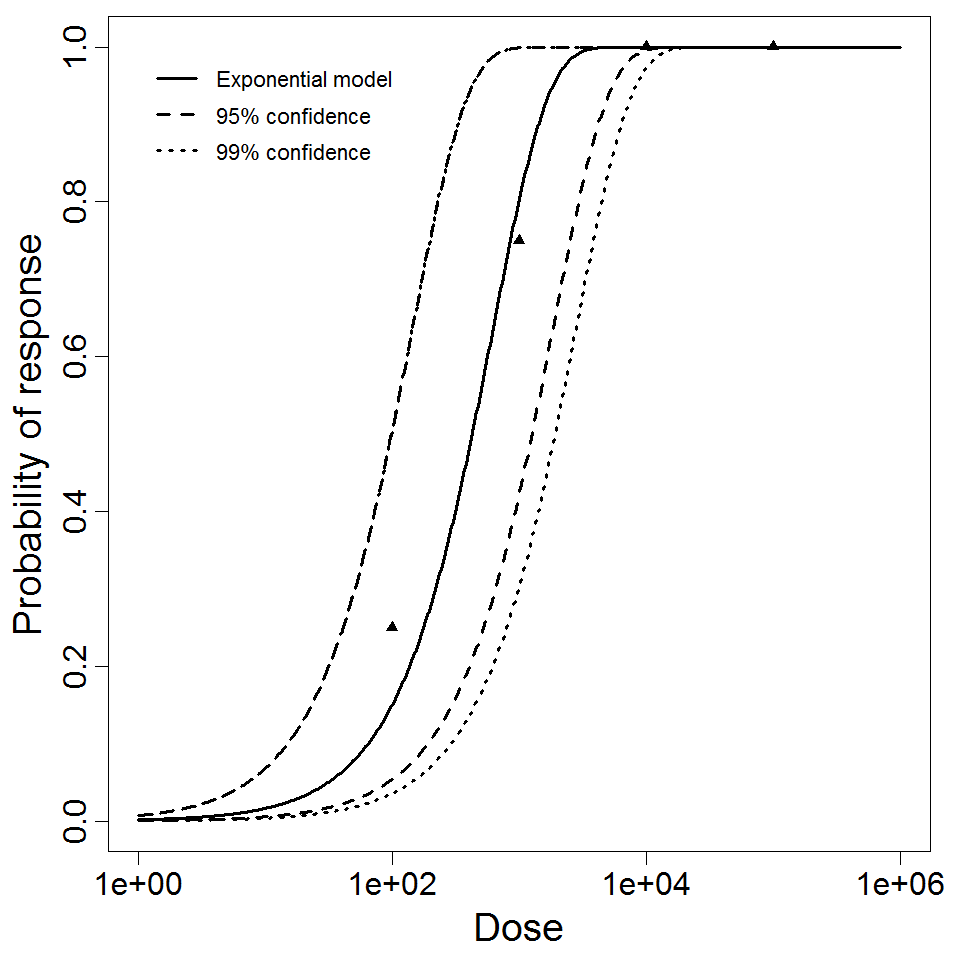
Exponential model plot, with confidence bounds around optimized model
# of Doses
4.00
Μodel
LD50/ID50
4.26E+02
Dose Units
Response
Exposure Route
Contains Preferred Model
k
1.63E-03
Agent Strain
CO92
Experiment ID
1
Host type
Experiment Dataset
| Dose | Dead | Survived | Total |
|---|---|---|---|
| 100 | 1 | 3 | 4 |
| 1000 | 3 | 1 | 4 |
| 1E+04 | 4 | 0 | 4 |
| 1E+05 | 4 | 0 | 4 |