Červa (1967a,b) studied white mice of the Czechoslovak H-strain weighing 13-15 grams inoculated intranasally by placing 0.02 mL of the A1 strain of Acanthamoeba over the nares of the ethyl-ether anesthetized mice (Cerva, 1967b).
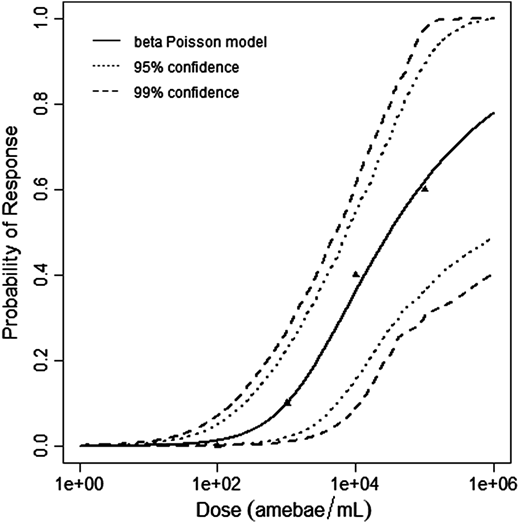
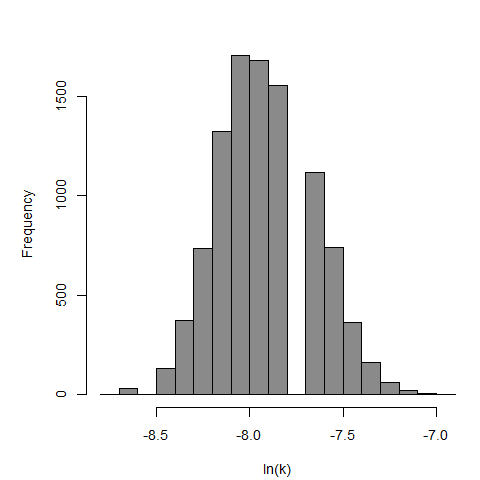
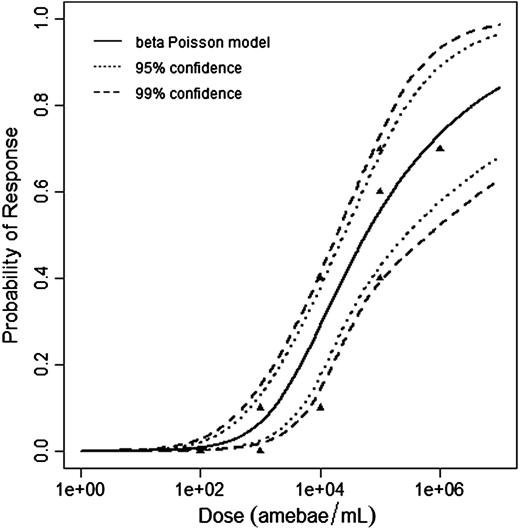
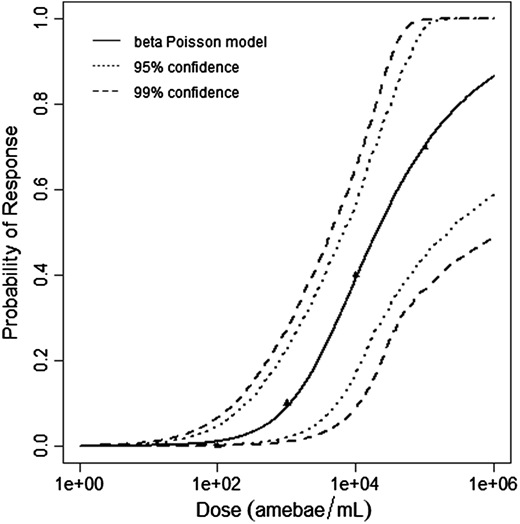
The beta-Poisson model provided the best fit to the data.
Cerva, L. (1967b). Intranasal, Intrapulmonary, and Intracardial Inoculation of Experimental Animals with Hartmanella castellanii. Folia Parasitologica (Praha), 14, 207–215.
| Dose (no. of organisms) | Positive Response | Negative Response | Total Subjects/Responses |
|---|---|---|---|
| 3 | 0 | 20 | 20 |
| 30 | 2 | 18 | 20 |
| 300 | 1 | 19 | 20 |
| 3000 | 9 | 11 | 20 |
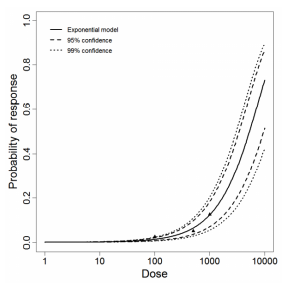
Culbertson et al. (1966) studied the pathogenicity of the HN-3 strain of A. castellanii (Culbertson et al., 1966; Marciano-Cabral & Cabral, 2003) on ether-anesthetized-specific-pathogen-free (SPF) mice. Cultures of amebae were grown in trypticase soy broth and diluted so that 0.03 mL of a concentrated suspension could be instilled intranasally into the mice by placing fluid over the nares (Culbertson et al., 1966; Culbertson, Ensminger, & Overton, 1965a; Culbertson, Ensminger, & Overton, 1965b).
The exponential model provided the best fit to the data.


Culbertson, C. G., Ensminger, P. W., & Overton, W. M. (1966). Hartmannella (Acanthamoeba): Experimental Chronic, Granulomatous Brain Infections Produced by New Isolates of Low Virulence. The American Journal of Clinical Pathology, 46(3), 305–314.
| Dose (no. of organisms) | Positive Response | Negative Response | Total Subjects/Responses |
|---|---|---|---|
| 100 | 2 | 78 | 80 |
| 500 | 9 | 71 | 80 |
| 1000 | 21 | 59 | 80 |
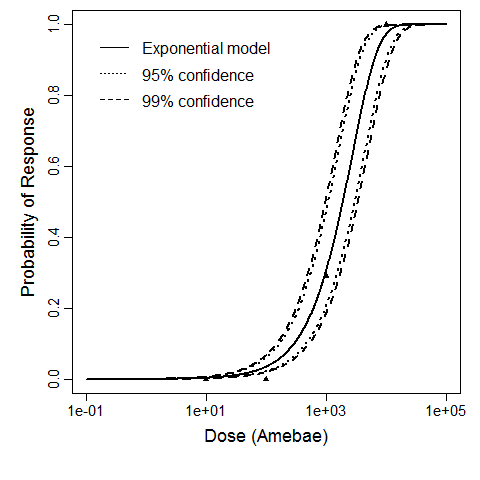
Culbertson et al. (1966) studied the pathogenicity of the HN-3 strain of A. castellanii (Culbertson et al., 1966; Marciano-Cabral & Cabral, 2003) on ether-anesthetized-specific-pathogen-free (SPF) mice. Cultures of amebae were grown in trypticase soy broth and diluted so that 0.03 mL of a concentrated suspension could be instilled intranasally into the mice by placing fluid over the nares (Culbertson et al., 1966; Culbertson, Ensminger, & Overton, 1965a; Culbertson, Ensminger, & Overton, 1965b).
The exponential model provided the best fit to the data.

Culbertson, C. G., Holmes, D. H., & Overton, W. M. (1965b). Hartmanella castellani (Acanthamoeba sp.). The American Journal of Clinical Pathology, 43(4), 361–364.
Culbertson, C. G., Ensminger, P. W., & Overton, W. M. (1966). Hartmannella (Acanthamoeba): Experimental Chronic, Granulomatous Brain Infections Produced by New Isolates of Low Virulence. The American Journal of Clinical Pathology, 46(3), 305–314.
| Dose (no. of organisms) | Positive Response | Negative Response | Total Subjects/Responses |
|---|---|---|---|
| 100 | 7 | 73 | 80 |
| 500 | 31 | 49 | 80 |
| 1000 | 43 | 37 | 80 |
Culbertson et al. (1966) studied the pathogenicity of the HN-3 strain of A. castellanii (Culbertson et al., 1966; Marciano-Cabral & Cabral, 2003) on ether-anesthetized-specific-pathogen-free (SPF) mice. Cultures of amebae were grown in trypticase soy broth and diluted so that 0.03 mL of a concentrated suspension could be instilled intranasally into the mice by placing fluid over the nares (Culbertson et al., 1966; Culbertson, Ensminger, & Overton, 1965a; Culbertson, Ensminger, & Overton, 1965b).
The exponential model provided the best fit to the data.

Culbertson, C. G., Holmes, D. H., & Overton, W. M. (1965b). Hartmanella castellani (Acanthamoeba sp.). The American Journal of Clinical Pathology, 43(4), 361–364.
Culbertson, C. G., Ensminger, P. W., & Overton, W. M. (1966). Hartmannella (Acanthamoeba): Experimental Chronic, Granulomatous Brain Infections Produced by New Isolates of Low Virulence. The American Journal of Clinical Pathology, 46(3), 305–314.
| Dose (no. of organsims) | Positive Responses | Negative Responses | Total Subjects/Responses |
|---|---|---|---|
| 100 | 2 | 78 | 80 |
| 500 | 4 | 76 | 80 |
| 1000 | 10 | 70 | 80 |
Badenoch et al. (1990) studied the combined effect of Acanthamoeba Ac118 (a group III isolate) and the bacterium Corynebacterium xerosis on the corneas of female Portion rats. A constant dose of 106 C. xerosis with increasing doses of Acanthamoeba spp. were injected into incisions in the rat corneas using a microsyringe.
The exponential model provided the best fit to the data.
| Dose (no. of organisms) | Positive Response | Negative Response | Total Subjects/Responses | |
|---|---|---|---|---|
| 10 | 0 | 8 | 8 | |
| 100 | 0 | 16 | 16 | |
| 1000 | 7 | 17 | 24 | |
| 10000 | 10 | 0 | 10 |
|
|
|
| ||||||||||||||||||||||
|
| ||||||||||||||||||||||