Description
Mice/phase I Ohio strain model data 
Dose Dead Survived Total
0.7 0 30 30
7 0 20 20
70 0 30 30
7000 0 30 30
7E+05 0 30 30
7E+06 1 19 20
7E+07 6 24 30
7E+08 16 14 30
7E+09 23 7 30
7E+10 19 1 20


Goodness of fit and model selection
Model Deviance Δ Degrees 
of freedom
χ20.95,1 
p-value
χ20.95,m-k 
p-value
Exponential 73.9 72.8 9 3.84 
0
16.9 
2.65e-12
Beta Poisson 1.11 8 15.5 
0.997
Beta-Poisson fits better than exponential; cannot reject good fit for beta-Poisson.


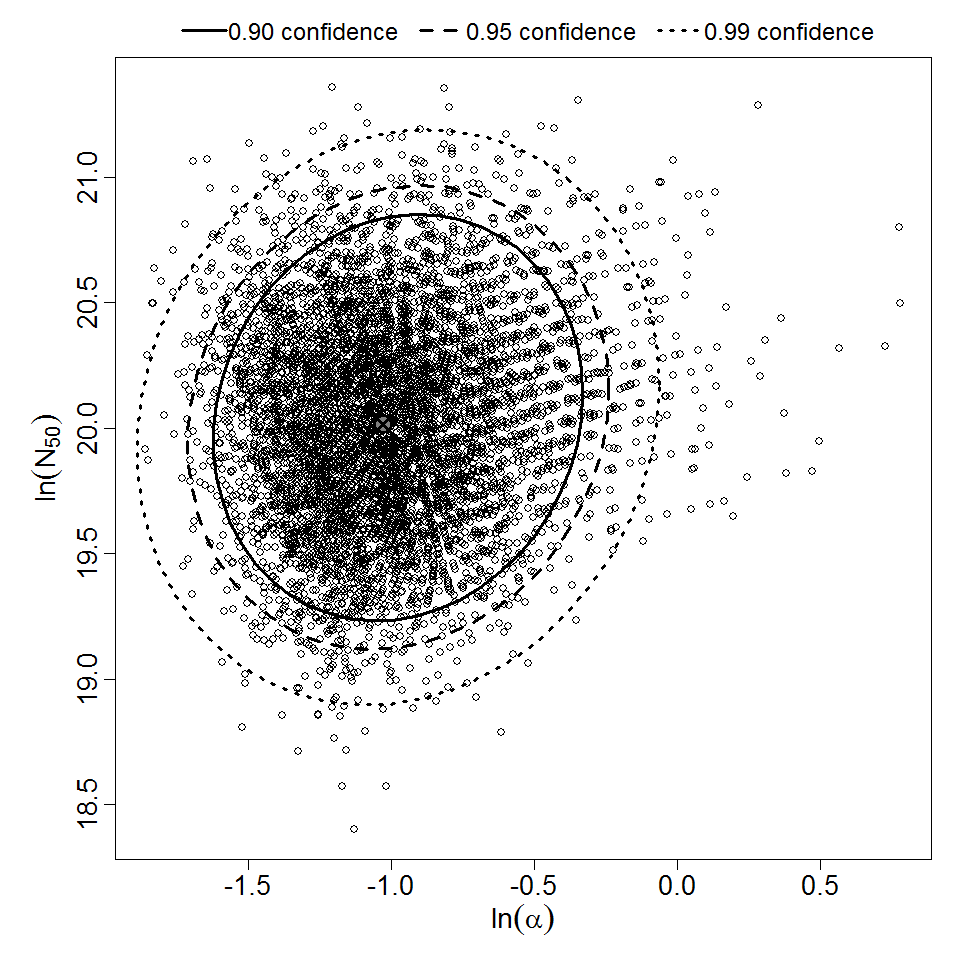
Optimized parameters for the beta-Poisson model, from 10000 bootstrap iterations
Parameter MLE estimate Percentiles
0.5% 2.5% 5% 95% 97.5% 99.5%
α 3.57E-01 1.91E-01 2.20E-01 2.38E-01 6.34E-01 7.08E-01 9.84E-01
N50 4.93E+08 1.89E+08 2.41E+08 2.73E+08 9.34E+08 1.06E+09 1.36E+09


Parameter scatter plot for beta Poisson model ellipses signify the 0.9, 0.95 and 0.99 confidence of the parameters.
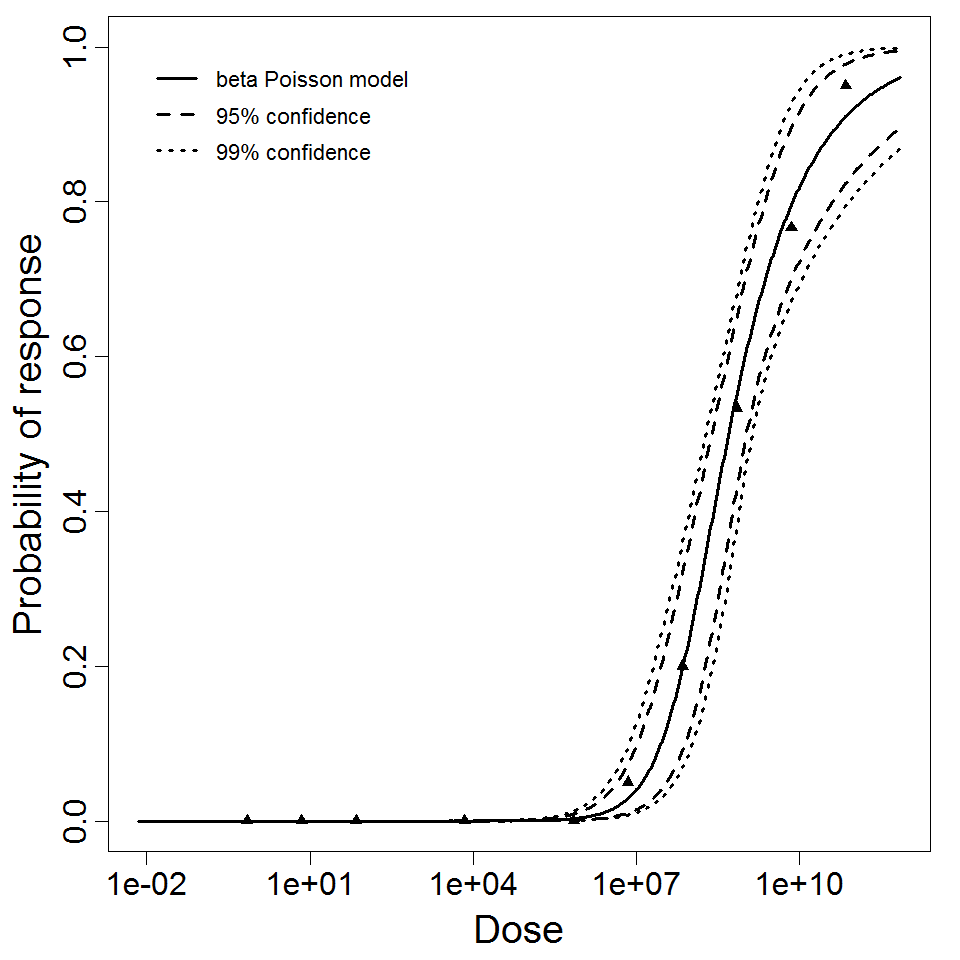
beta Poisson model plot, with confidence bounds around optimized model


# of Doses
10.00
Μodel
N50
4.93E+08
LD50/ID50
4.93E+08
Dose Units
Response
Exposure Route
Contains Preferred Model
a
3.57E-01
Agent Strain
phase I Ohio
Experiment ID
28
Host type
Description
Human/Staphylococcus aureus 
Dose Infected Non-infected Total
2430000 4 16 20
6270000 8 12 20
1.27E+07 13 7 20
2.5E+07 14 6 20
3.34E+07 19 1 20
3.91E+07 20 0 20


Goodness of fit and model selection
Model Deviance Δ Degrees 
of freedom
χ20.95,1 
p-value
χ20.95,m-k 
p-value
Exponential 5.52 5.36e-05 5 3.84 
0.994
11.1 
0.356
Beta Poisson 5.52 4 9.49 
0.238
Exponential is preferred to beta-Poisson; cannot reject good fit for exponential.


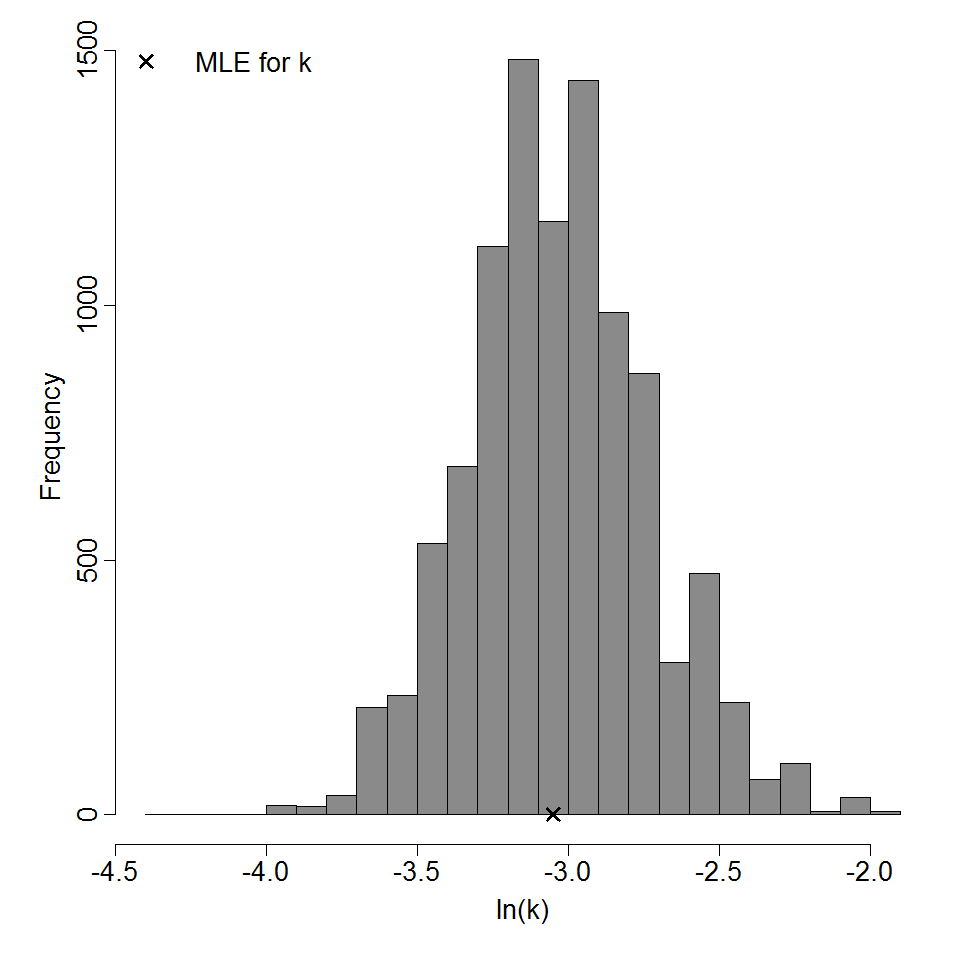
Optimized k parameter for the exponential model, from 10000 bootstrap iterations
Parameter MLE estimate Percentiles
0.5% 2.5% 5% 95% 97.5% 99.5%
k 7.64E-08 5.67E-08 6.19E-08 6.41E-08 1.00E-07 1.02E-07 1.35E-06
ID50/LD50/ETC* 9.08E+06 2.70E+06 6.79E+06 6.93E+06 1.08E+07 1.12E+07 1.22E+07
*Not a parameter of the exponential model; however, it facilitates comparison with other models.


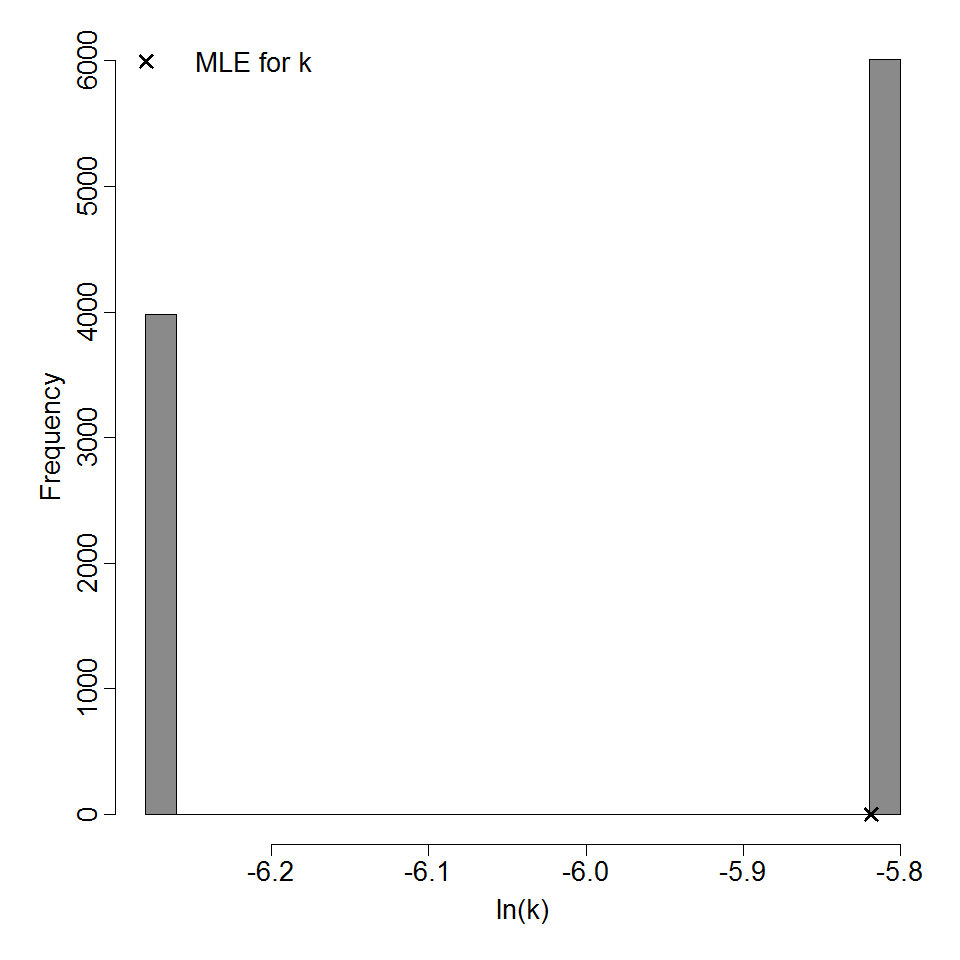
Parameter histogram for exponential model (uncertainty of the parameter)
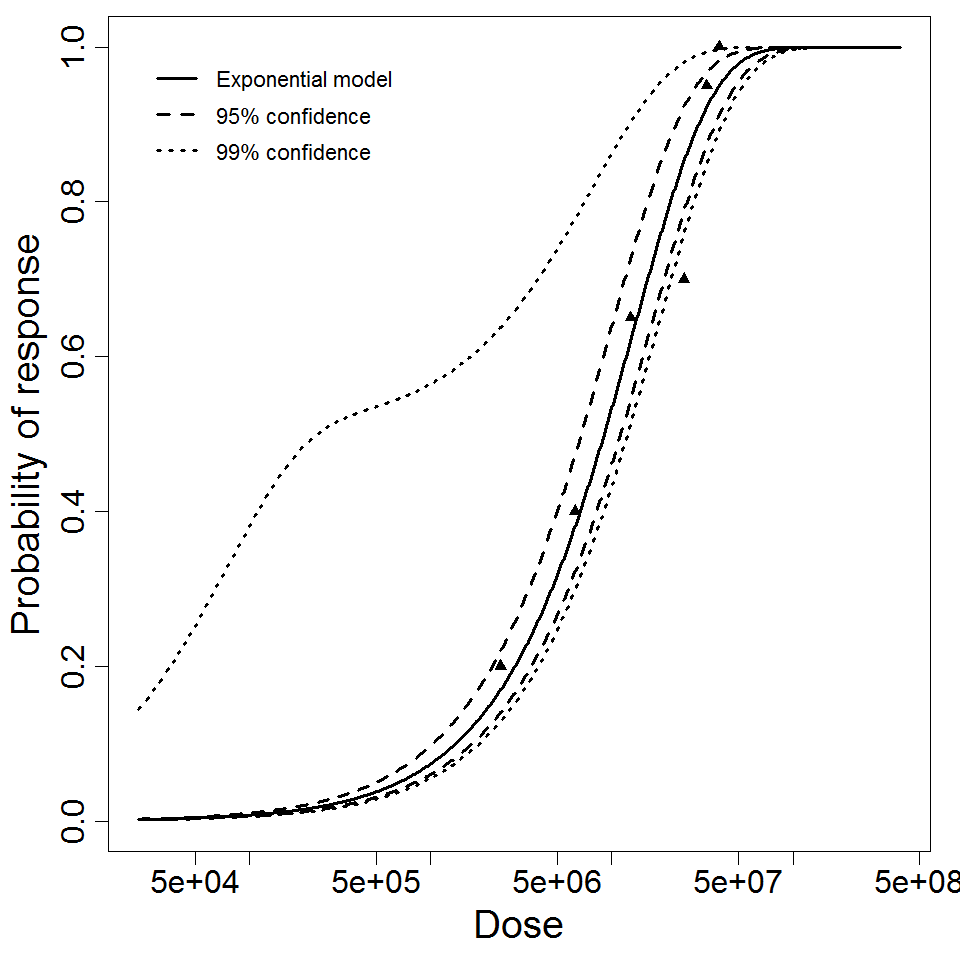
Exponential model plot, with confidence bounds around optimized model

# of Doses
6.00
Μodel
LD50/ID50
9.08E+06
Dose Units
Response
Exposure Route
Contains Preferred Model
k
7.64E-08
Experiment ID
278
Host type
Description
Mice/ Aa strain model data
Dose Dead Survived Total
1E+04 0 22 22
1E+05 1 21 22
1E+06 1 10 11
1E+07 16 6 22
1E+08 22 0 22


Goodness of fit and model selection
Model Deviance Δ Degrees 
of freedom
χ20.95,1 
p-value
χ20.95,m-k 
p-value
Exponential 1.27 0.0341 4 3.84 
0.854
9.49 
0.867
Beta Poisson 1.23 3 7.81 
0.745
Exponential is preferred to beta-Poisson; cannot reject good fit for exponential.


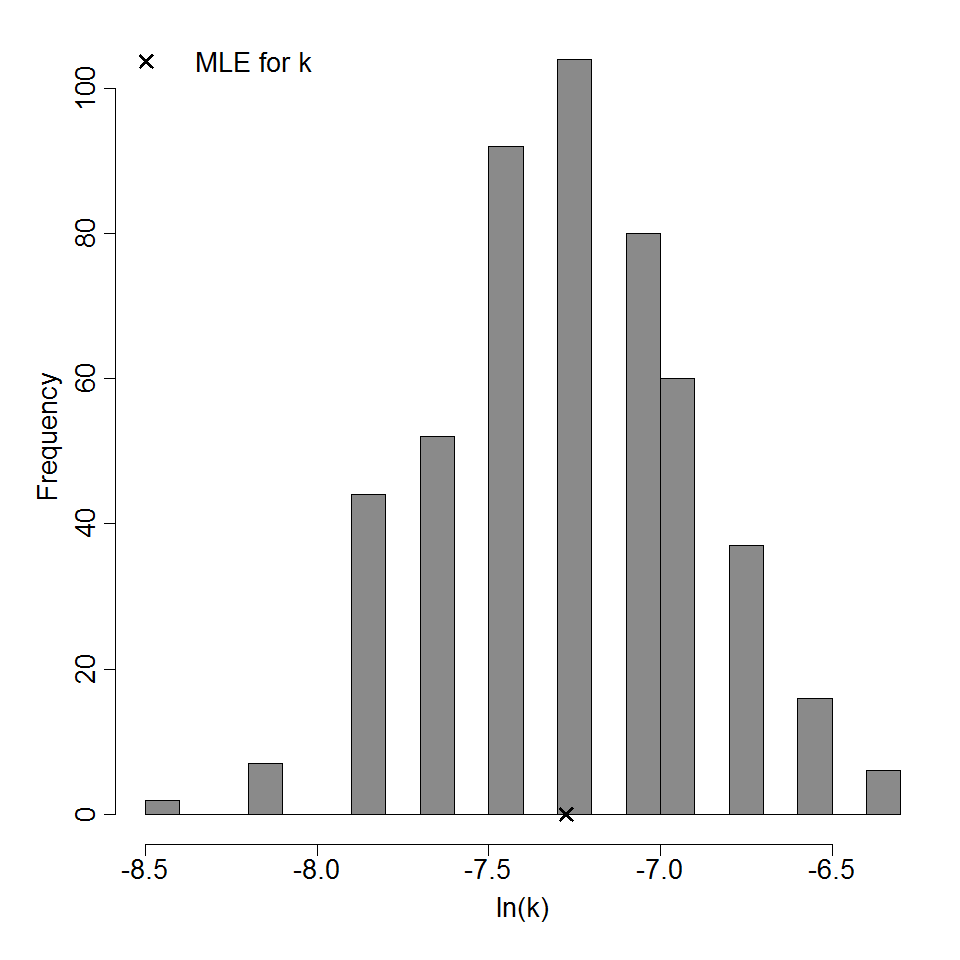
Optimized k parameter for the exponential model, from 10000 bootstrap iterations
Parameter MLE estimate Percentiles
0.5% 2.5% 5% 95% 97.5% 99.5%
k 1.33E-07 6.86E-08 7.91E-08 8.83E-08 2.06E-07 2.24E-07 2.75E-07
ID50/LD50/ETC* 5.22E+06 2.52E+06 3.10E+06 3.37E+06 7.85E+06 8.76E+06 1.01E+07
*Not a parameter of the exponential model; however, it facilitates comparison with other models.


Parameter histogram for exponential model (uncertainty of the parameter)

Exponential model plot, with confidence bounds around optimized model

# of Doses
5.00
Μodel
LD50/ID50
5.22E+06
Dose Units
Response
Exposure Route
Contains Preferred Model
k
1.33E-07
Agent Strain
Aa strain
Experiment ID
275
Host type
Description

Optimization Output for experiment 274

Monkeys / SCHU S-4 model data 
Dose Dead Survived Total
5 1 5 6
11 3 3 6
32 4 2 6
65 6 0 6


Goodness of fit and model selection
Model Deviance Δ Degrees 
of freedom
χ20.95,1 
p-value
χ20.95,m-k 
p-value
Exponential 1.26 -0.000367 3 3.84 
1
7.81 
0.738
Beta Poisson 1.26 2 5.99 
0.531
Exponential is preferred to beta-Poisson; cannot reject good fit for exponential.


Optimized k parameter for the exponential model, from 10000 bootstrap iterations
Parameter MLE estimate Percentiles
0.5% 2.5% 5% 95% 97.5% 99.5%
k 4.73E-02 2.28E-02 2.72E-02 2.98E-02 7.81E-02 9.03E-02 1.11E-01
ID50/LD50/ETC* 1.46E+01 6.27E+00 7.67E+00 8.88E+00 2.33E+01 2.55E+01 3.04E+01
*Not a parameter of the exponential model; however, it facilitates comparison with other models.


Parameter histogram for exponential model (uncertainty of the parameter)
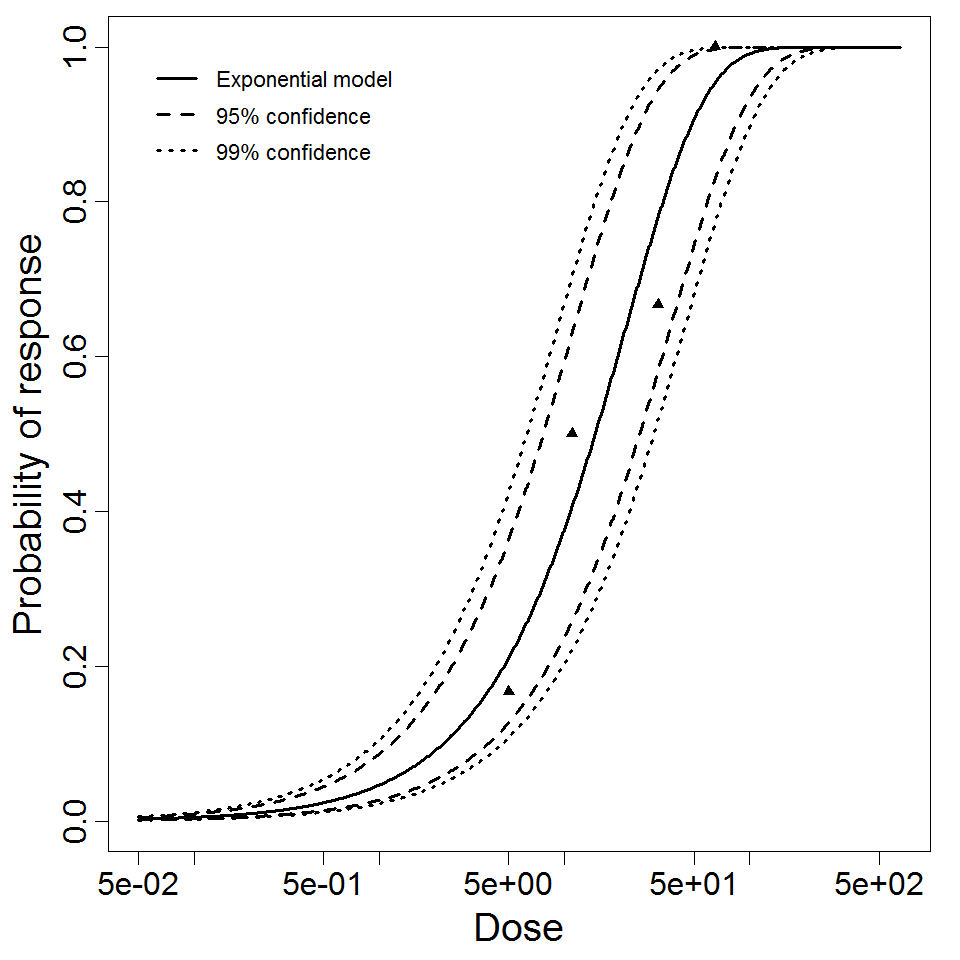
Exponential model plot, with confidence bounds around optimized model

# of Doses
4.00
Μodel
LD50/ID50
1.46E+01
Dose Units
Response
Exposure Route
Contains Preferred Model
k
4.73E-02
Agent Strain
SCHU S-4
Experiment ID
274
Host type
Description
Dose response data
Dose Infected Non-infected Total
100 6 6 12
1E+05 6 6 12
1E+08 10 2 12


Goodness of fit and model selection
Model Deviance Δ Degrees 
of freedom
χ20.95,1 
p-value
χ20.95,m-k 
p-value
Exponential 193 192 2 3.84 
0
5.99 
0
Beta Poisson 1.43 1 3.84 
0.231
Beta-Poisson fits better than exponential; cannot reject good fit for beta-Poisson.


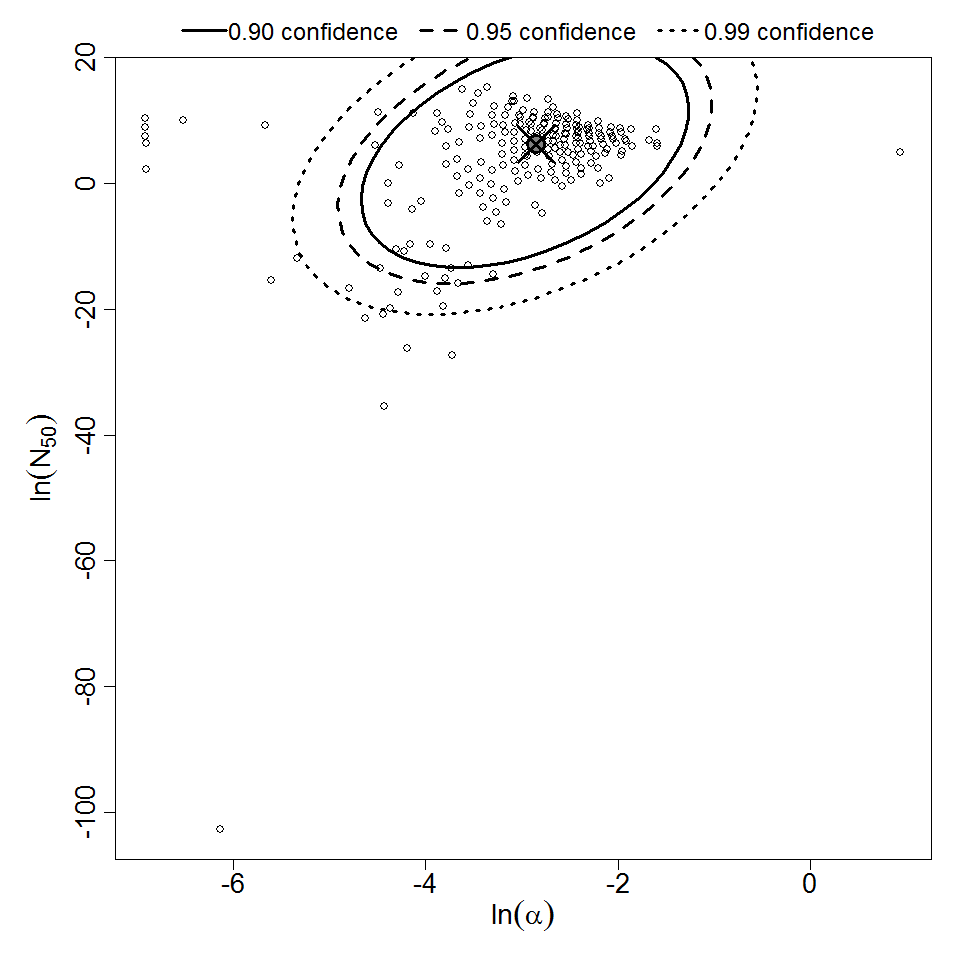
Optimized parameters for the beta-Poisson model, from 10000 bootstrap iterations
Parameter MLE estimate Percentiles
0.5% 2.5% 5% 95% 97.5% 99.5%
α 5.79E-02 9.94E-04 9.78E-03 1.25E-02 1.27E-01 1.42E-01 1.87E-01
N50 4.8E+02 3.44E-13 5.25E-08 1.89E-05 5.61E+04 1.50E+05 4.41E+06


Parameter scatter plot for beta Poisson model ellipses signify the 0.9, 0.95 and 0.99 confidence of the parameters

beta Poisson model plot, with confidence bounds around optimized model

# of Doses
3.00
Μodel
N50
4.8E+02
LD50/ID50
4.8E+02
Dose Units
Response
Exposure Route
Contains Preferred Model
a
5.79E-02
Agent Strain
sub sp. Paratuberculosis IOI strain
Experiment ID
263
Host type
Description
Dose response data
Dose Infected Non-infected Total
1000 8 8 16
1E+07 16 0 16
1E+09 16 0 16


Goodness of fit and model selection
Model Deviance Δ Degrees 
of freedom
χ20.95,1 
p-value
χ20.95,m-k 
p-value
Exponential 3.07e-05 7.15e-06 2 3.84 
0.998
5.99 
1
Beta Poisson 2.36e-05 1 3.84 
0.996
Exponential is preferred to beta-Poisson; cannot reject good fit for exponential.


Optimized k parameter for the exponential model, from 10000 bootstrap iterations
Parameter MLE estimate Percentiles
0.5% 2.5% 5% 95% 97.5% 99.5%
k 6.93E-04 2.08E-04 2.88E-04 3.75E-04 1.16E-03 1.39E-03 1.67E-03
ID50/LD50/ETC* 1E+03 4.14E+02 5.00E+02 5.96E+02 1.85E+03 2.41E+03 3.34E+03
*Not a parameter of the exponential model; however, it facilitates comparison with other models.


Parameter histogram for Exponential model (uncertainty of the parameter)

Exponential model plot, with confidence bounds around optimized model

# of Doses
3.00
Μodel
LD50/ID50
1000
Dose Units
Response
Exposure Route
Contains Preferred Model
k
6.93E-04
Agent Strain
sub sp. Paratuberculosis Bovine
Experiment ID
262
Host type
Description
Mice/MHV-1 strains model data [3]
Dose Dead Survived Total
5 0 5 5
50 1 4 5
500 3 2 5
5000 5 0 5


Goodness of fit and model selection
Model Deviance Δ Degrees 
of freedom
χ20.95,1 
p-value
χ20.95,m-k 
p-value
Exponential 0.606 0.0689 3 3.84 
0.793
7.81 
0.895
Beta Poisson 0.537 2 5.99 
0.765
Exponential is preferred to beta-Poisson; cannot reject good fit for exponential.


Optimized k parameter for the exponential model, from 10000 bootstrap iterations
Parameter MLE estimate Percentiles
0.5% 2.5% 5% 95% 97.5% 99.5%
k 2.14E-03 6.25E-04 6.55E-04 9.06E-04 6.58E-03 6.58E-03 9.86E-03
ID50/LD50/ETC* 3.24E+02 7.03E+01 1.05E+02 1.05E+02 7.65E+02 1.06E+03 1.11E+03
*Not a parameter of the exponential model; however, it facilitates comparison with other models.


Parameter histogram for exponential model (uncertainty of the parameter)

Exponential model plot, with confidence bounds around optimized model

# of Doses
4.00
Μodel
LD50/ID50
3.24E+02
Dose Units
Response
Exposure Route
Contains Preferred Model
k
2.14E-03
Agent Strain
MHV-1
Experiment ID
261
Host type
Description
Pooled dose response model data [1]
Dose Dead Survived Total
5 0 5 5
50 1 4 5
240 1 2 3
500 3 2 5
800 3 0 3
2400 2 0 2
5000 5 0 5
12000 6 0 6


Goodness of fit and model selection
Model Deviance Δ Degrees 
of freedom
χ20.95,1 
p-value
χ20.95,m-k 
p-value
Exponential 1.75 -0.00181 7 3.84 
1
14.1 
0.972
Beta Poisson 1.75 6 12.6 
0.941
Exponential is preferred to beta-Poisson; cannot reject good fit for exponential.


Optimized k parameter for the exponential model, from 10000 bootstrap iterations
Parameter MLE estimate Percentiles
0.5% 2.5% 5% 95% 97.5% 99.5%
k 2.46E-03 1.07E-03 1.28E-03 1.35E-03 4.59E-03 5.27E-03 6.80E-03
ID50/LD50/ETC* 2.82E+02 1.02E+02 1.32E+02 1.51E+02 5.13E+02 5.43E+02 6.47E+02
*Not a parameter of the exponential model; however, it facilitates comparison with other models.


Parameter histogram for exponential model (uncertainty of the parameter)

Exponential model plot, with confidence bounds around optimized model

# of Doses
0.00
Μodel
LD50/ID50
2.82E+02
Dose Units
Response
Exposure Route
Contains Preferred Model
k
2.46E-03
Agent Strain
rSARS-CoV
Experiment ID
260, 261
Description
mice/rSARS-CoV strain model data [2]
Dose Dead Survived Total
240 1 2 3
800 3 0 3
2400 2 0 2
12000 6 0 6


Goodness of fit and model selection
Model Deviance Δ Degrees 
of freedom
χ20.95,1 
p-value
χ20.95,m-k 
p-value
Exponential 0.968 -0.000923 3 3.84 
1
7.81 
0.809
Beta Poisson 0.969 2 5.99 
0.616
Exponential is preferred to beta-Poisson; cannot reject good fit for exponential.


Optimized k parameter for the exponential model, from 10000 bootstrap iterations
Parameter MLE estimate Percentiles
0.5% 2.5% 5% 95% 97.5% 99.5%
k 2.97E-03 1.90E-03 1.90E-03 1.90E-03 2.97E-03 2.97E-03 2.97E-03
ID50/LD50/ETC* 2.33E+02 2.33E+02 2.33E+02 2.33E+02 3.64E+02 3.64E+02 3.64E+02
*Not a parameter of the exponential model; however, it facilitates comparison with other models.


Parameter histogram for exponential model (uncertainty of the parameter)

Exponential model plot, with confidence bounds around optimized model

# of Doses
4.00
Μodel
LD50/ID50
2.33E+02
Dose Units
Response
Exposure Route
Contains Preferred Model
k
2.97E-03
Agent Strain
rSARS-CoV
Experiment ID
260
Host type
Description
Mice/Nine mile phase I model data 
Dose Dead Survived Total
0.05 0 10 10
0.5 0 10 10
5 0 10 10
50 0 10 10
501 0 10 10
5010 0 10 10
50100 0 10 10
501000 0 10 10
5010000 0 10 10
5.01E+07 0 10 10
5.01E+08 1 9 10
5.01E+09 3 7 10
5.01E+10 9 1 10


Goodness of fit and model selection
Model Deviance Δ Degrees 
of freedom
χ20.95,1 
p-value
χ20.95,m-k 
p-value
Exponential 1.63 0.936 12 3.84 
0.333
21 
1
Beta Poisson 0.693 11 19.7 
1
Exponential is preferred to beta-Poisson; cannot reject good fit for exponential.


Optimized k parameter for the exponential model, from 10000 bootstrap iterations
Parameter MLE estimate Percentiles
0.5% 2.5% 5% 95% 97.5% 99.5%
k 5.7E-11 2.31E-11 2.94E-11 3.33E-11 1.38E-10 1.61E-10 2.13E-10
ID50/LD50/ETC* 1.22E+10 3.25E+09 4.30E+09 5.02E+09 2.08E+10 2.36E+10 2.99E+10
*Not a parameter of the exponential model; however, it facilitates comparison with other models.


Parameter histogram for exponential model (uncertainty of the parameter)

Exponential model plot, with confidence bounds around optimized model

# of Doses
13.00
Μodel
LD50/ID50
1.22E+10
Dose Units
Response
Exposure Route
Contains Preferred Model
k
5.7E-11
Agent Strain
Nine mile phase I
Experiment ID
26
Host type