Please Note
The results from this experiment are not recommended for use, rather they are present for reference purposes. The confidence intervals are not complete for this experiment since the data is not allowing for a stable bootstrap outcome. It is recommended to use the recommended model as this data is likely just capable of passing the test of trend, but still likely suboptimal for dose response modeling purposes.
Human Inaba Strain 569B
| Dose |
Diarrhea or culture positive |
No diarrhea or culture positive |
Total |
| 1E+04 |
0 |
2 |
2 |
| 1E+06 |
0 |
4 |
4 |
| 1E+07 |
0 |
4 |
4 |
| 1E+08 |
2 |
2 |
4 |
| 1E+09 |
1 |
1 |
2 |
| 1E+10 |
0 |
1 |
1 |
| 1E+11 |
2 |
0 |
2 |
|
Goodness of fit and model selection
| Model |
Deviance |
Δ |
Degrees
of freedom |
χ20.95,1
p-value
|
χ20.95,m-k
p-value
|
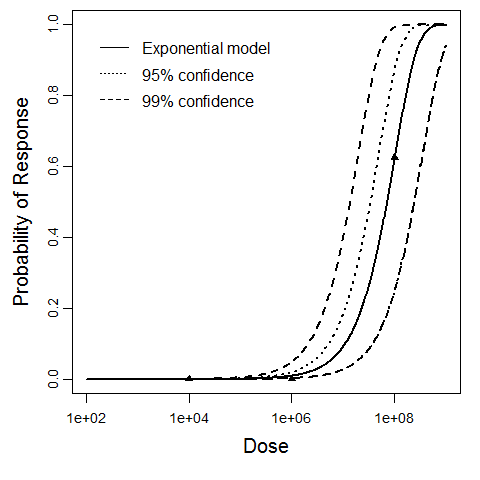
| Exponential |
15.1 |
10.4 |
6 |
3.84
0.00126
|
12.6
0.0193
|
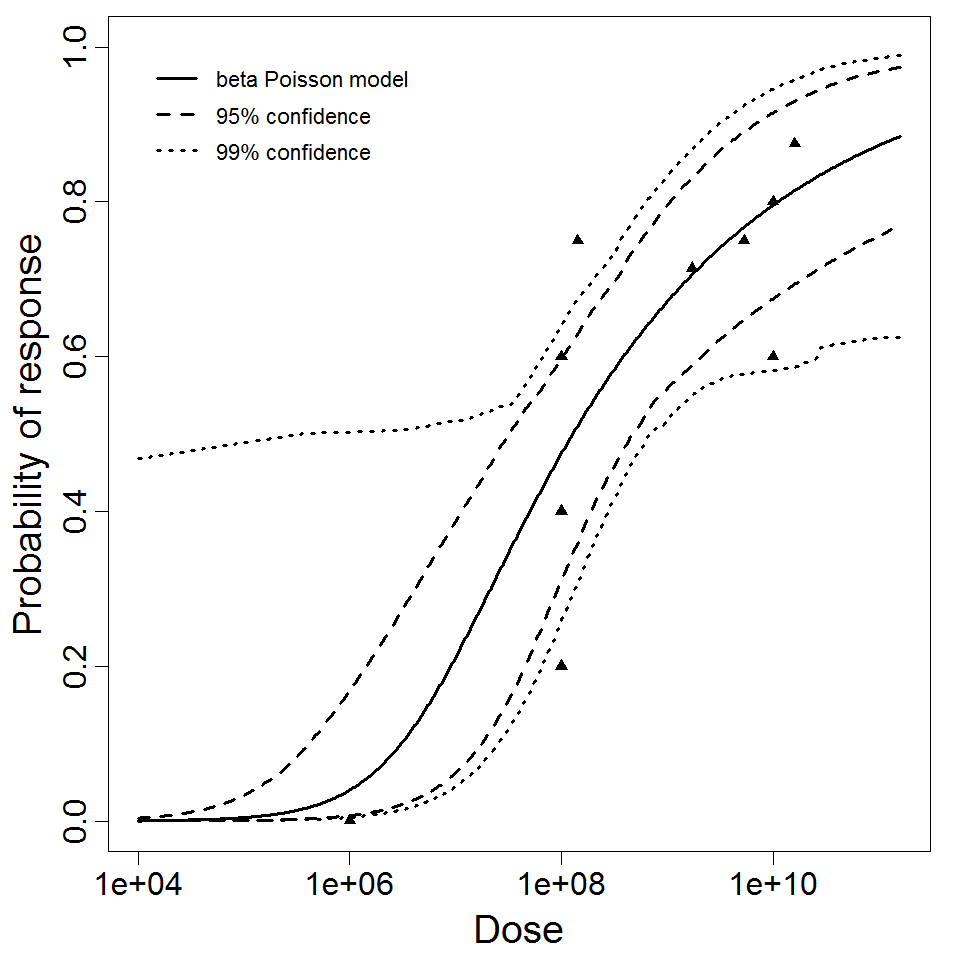
| Beta Poisson |
4.72 |
5 |
11.1
0.451
|
| Beta-Poisson fits better than exponential; cannot reject good fit for beta-Poisson. |
|
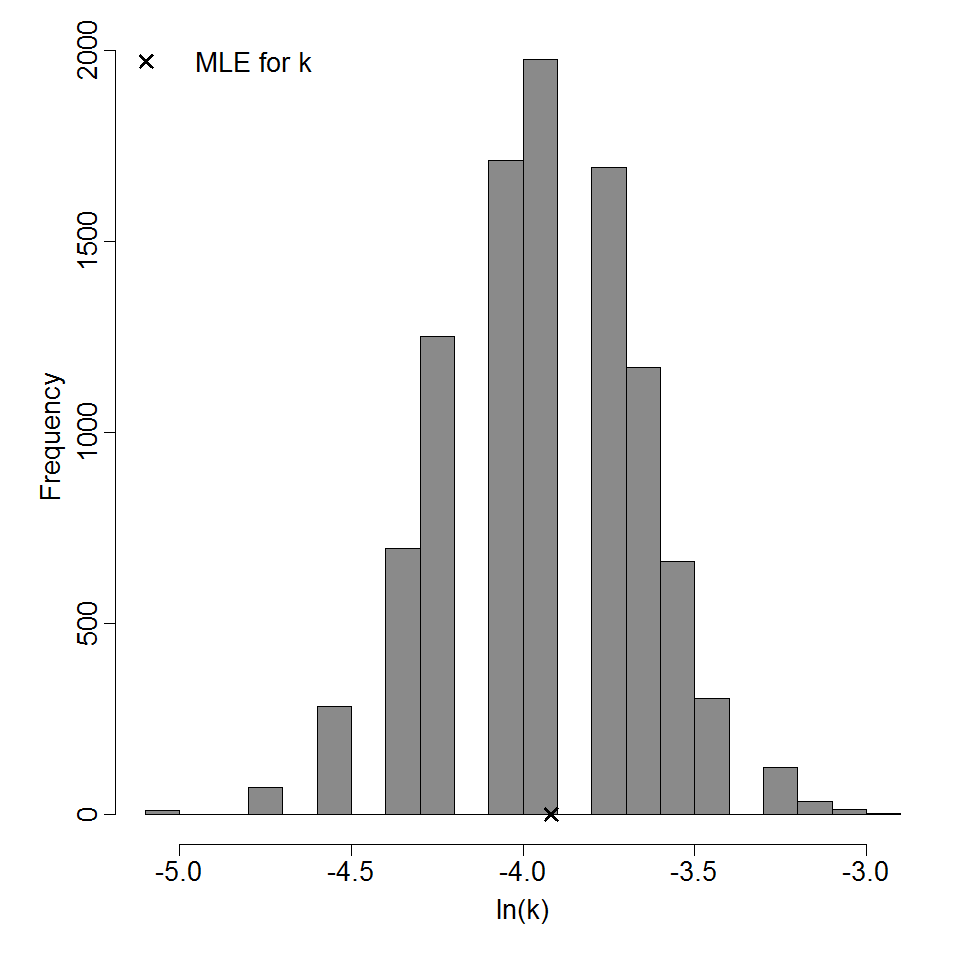
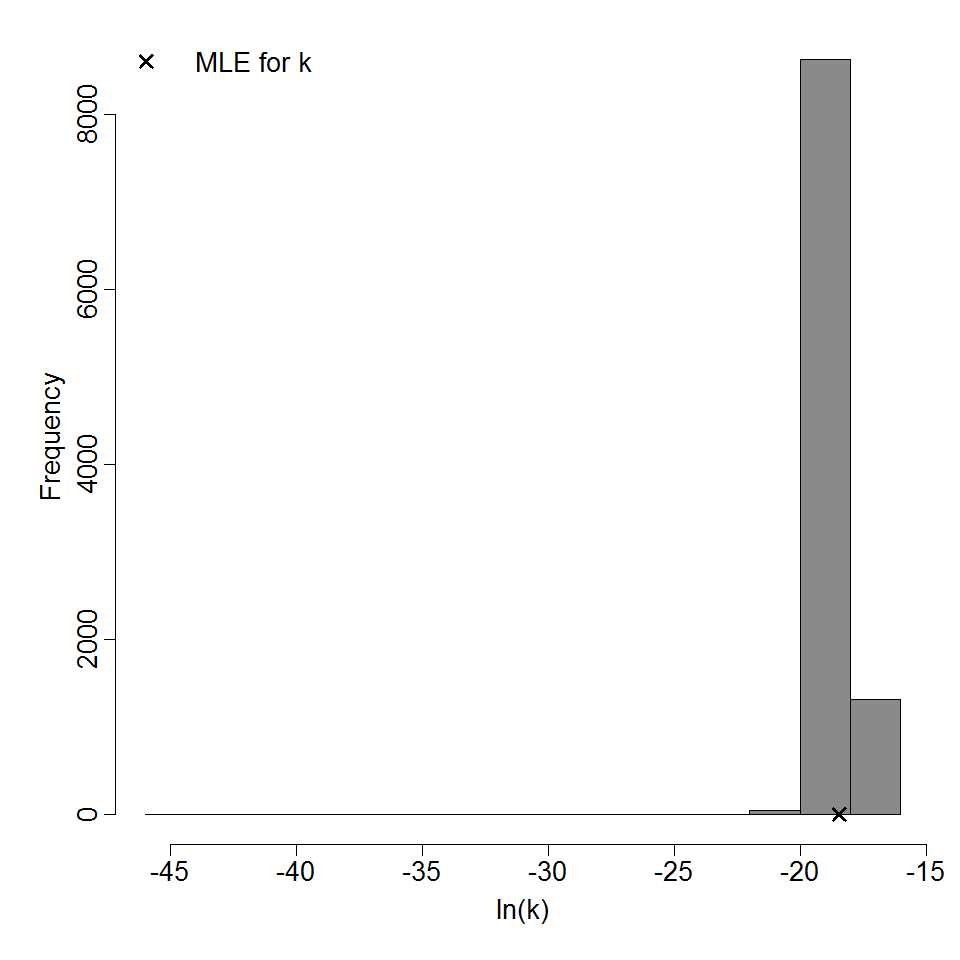
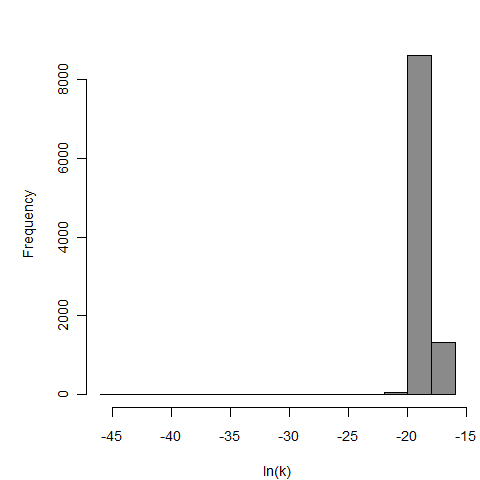
Optimized parameters for the beta-Poisson model, from 10000 bootstrap iterations
| Parameter |
MLE estimate |
Percentiles |
| 0.5% |
2.5% |
5% |
95% |
97.5% |
99.5% |
| α |
1.98E-01 |
9.92E-04 |
9.92E-04 |
1.04E-03 |
3.20E-01 |
3.65E-01 |
4.07E-01 |
| N50
|
6.36E+08 |
8.26E+05 |
8.26E+05 |
1.18E+08 |
5.33E+207 |
5.33E+207 |
8.87E+254 |
|
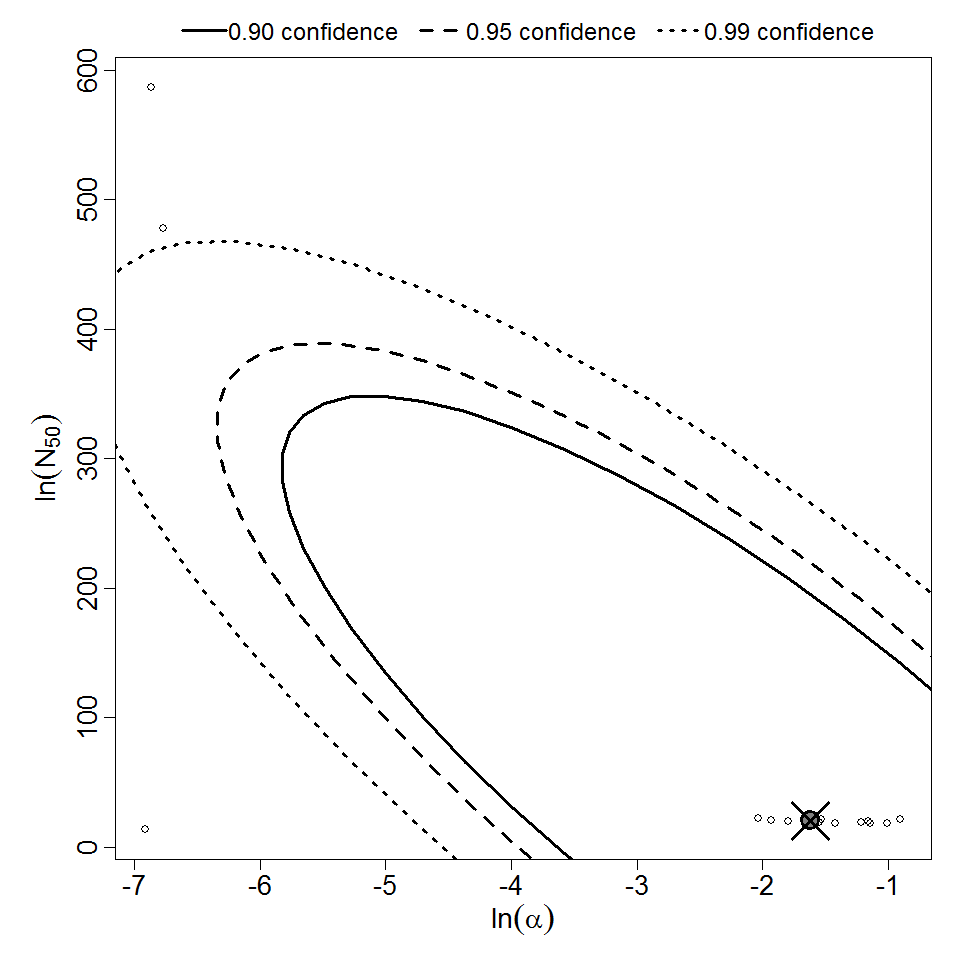
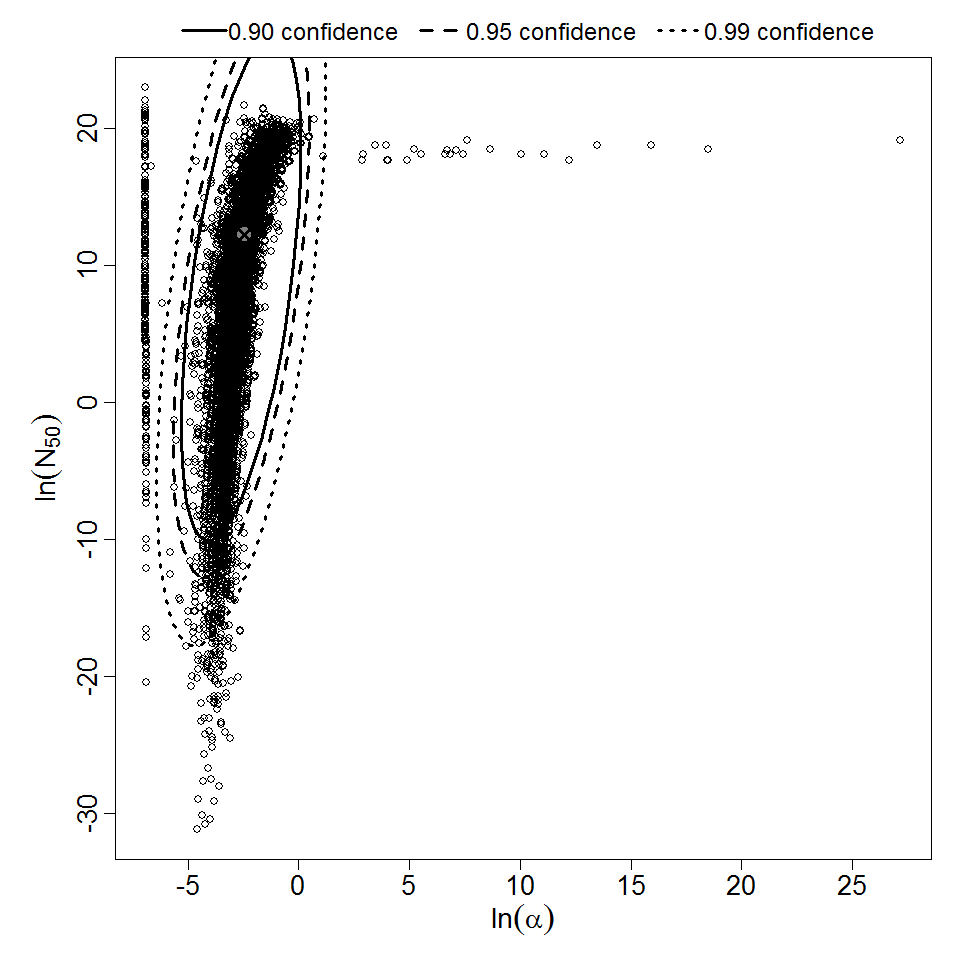
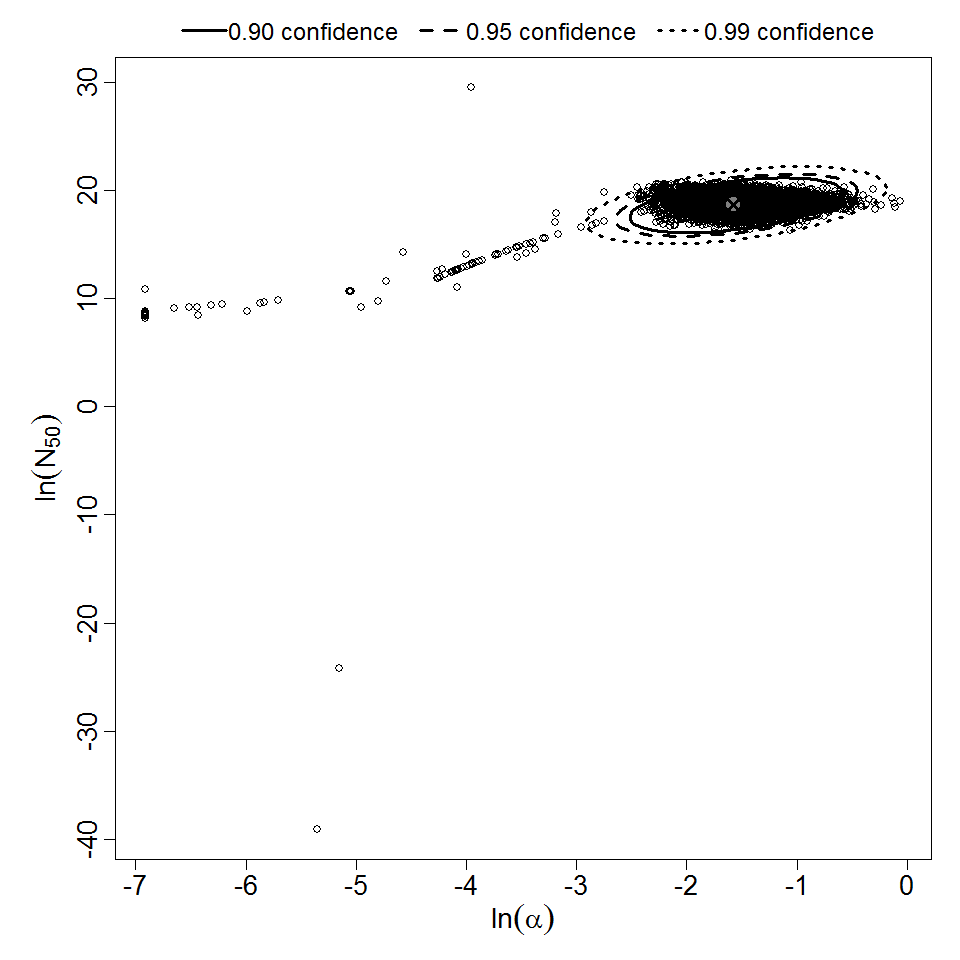
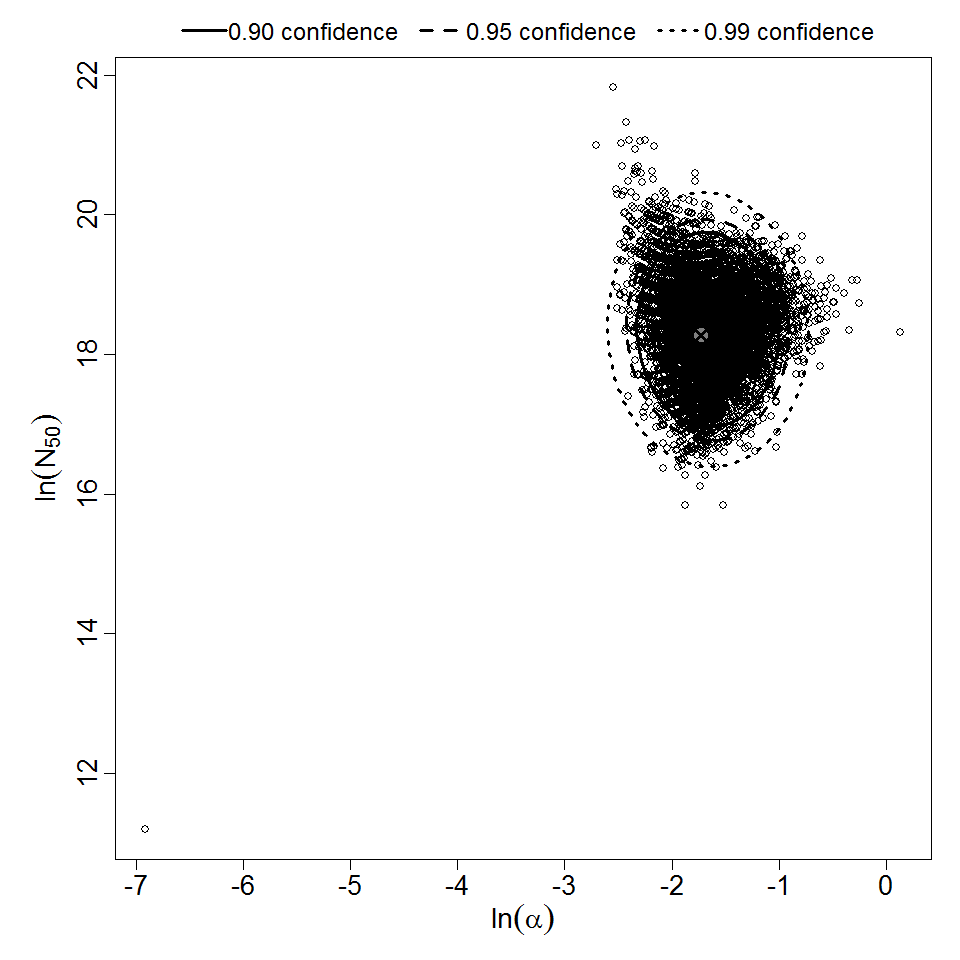
Parameter scatter plot for beta Poisson model ellipses signify the 0.9, 0.95 and 0.99 confidence of the parameters.

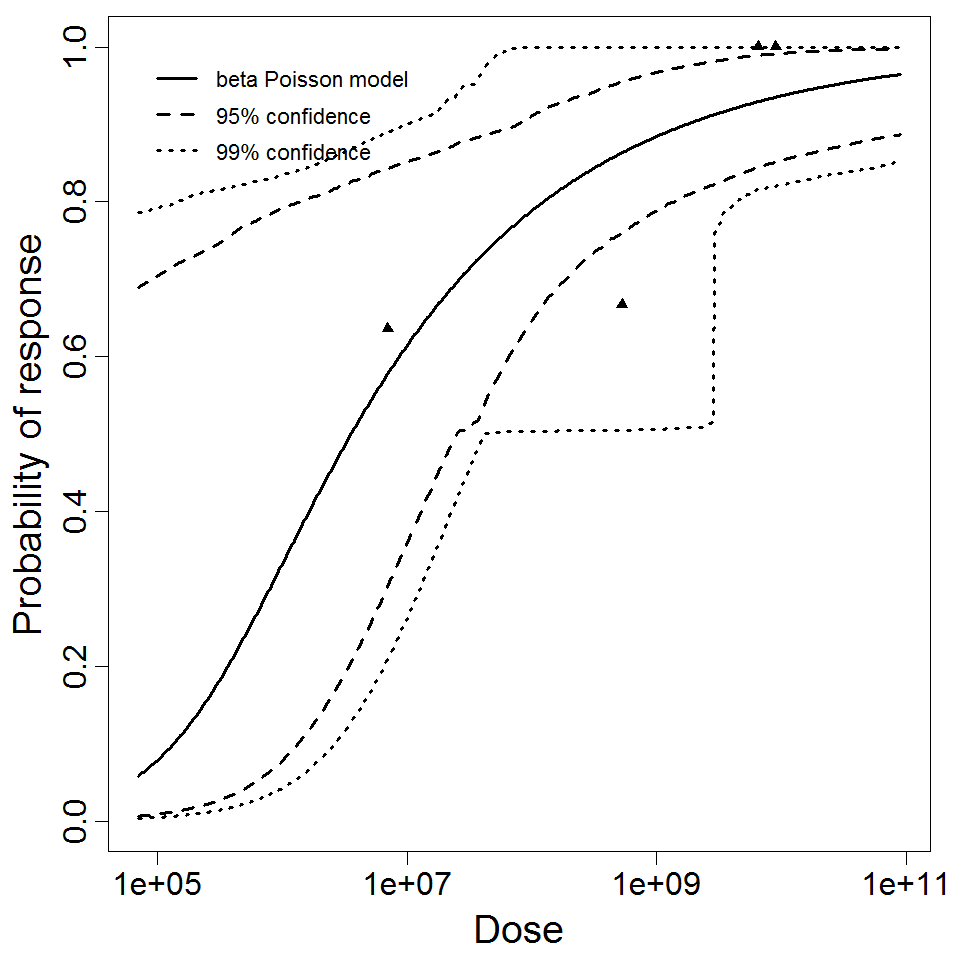
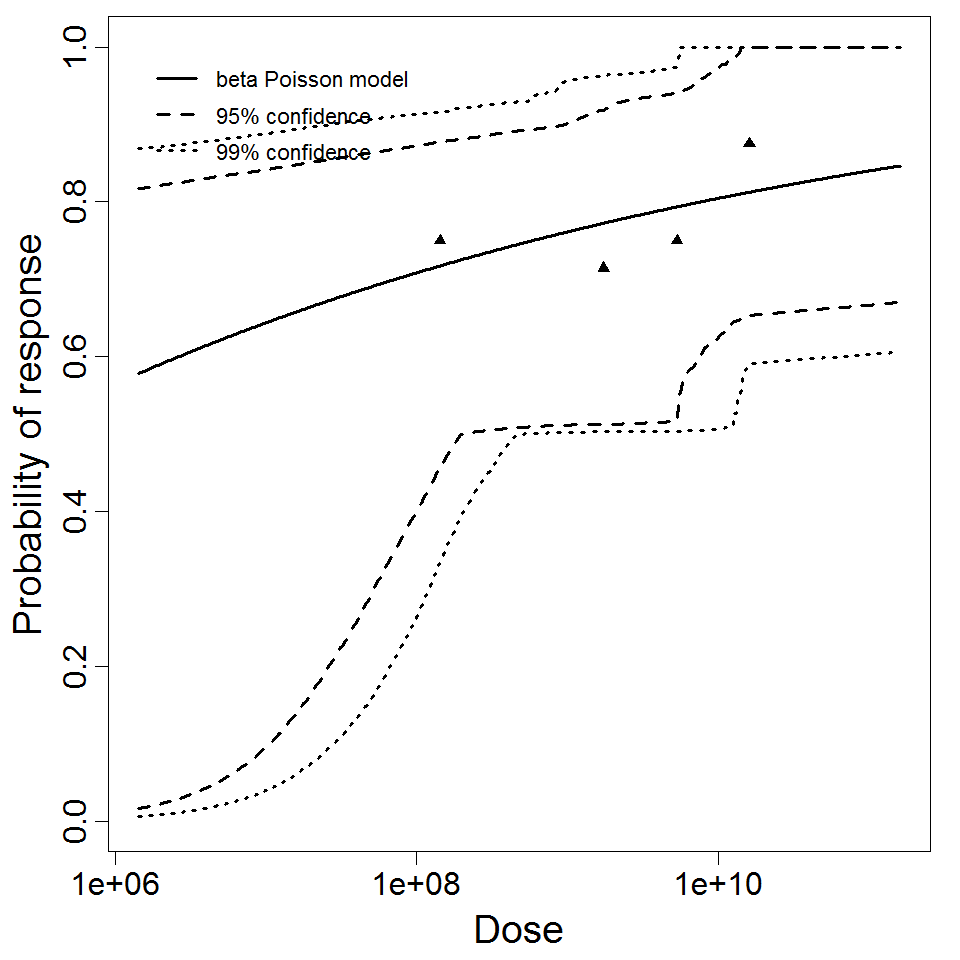
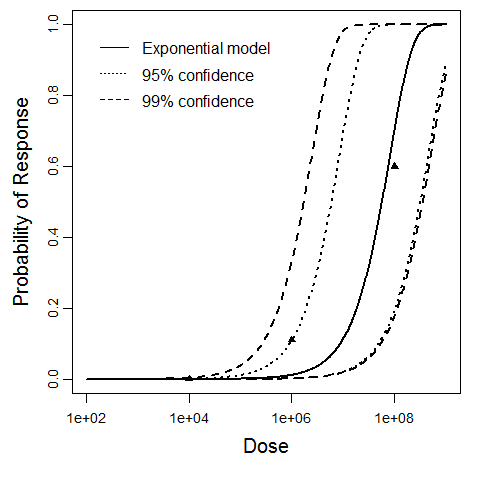
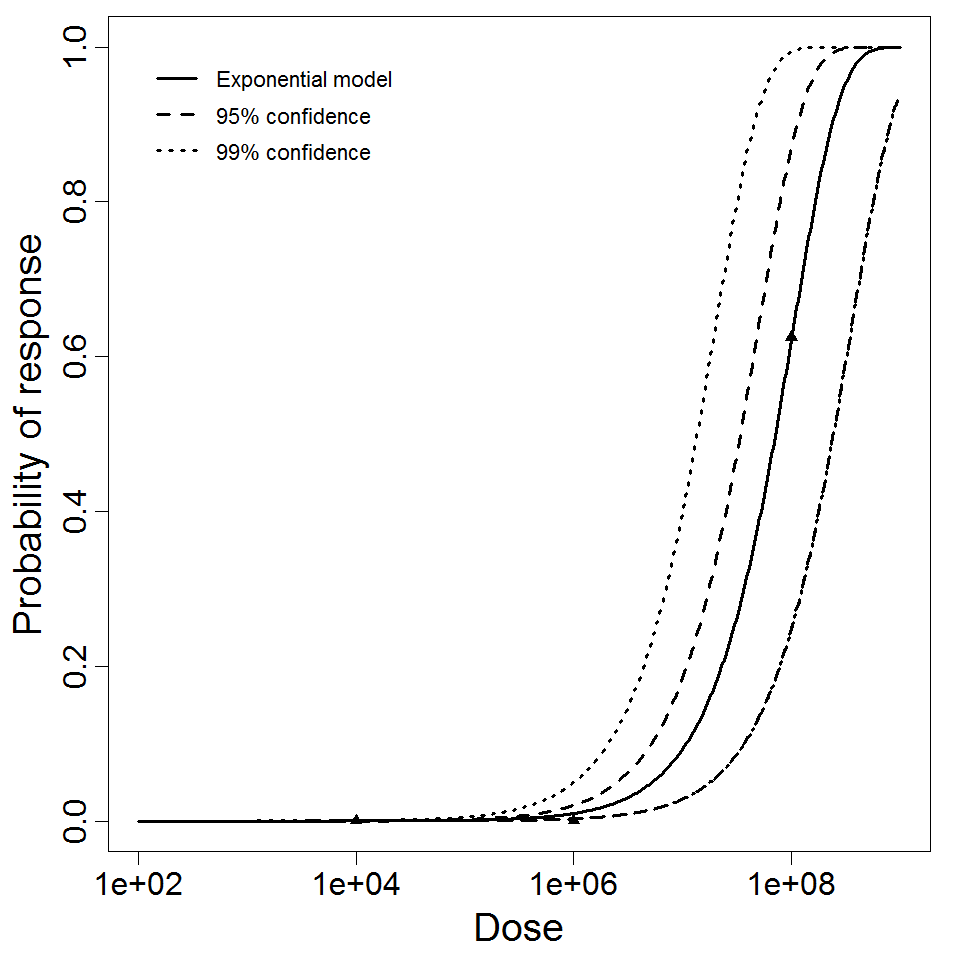
beta Poisson model plot, with confidence bounds around optimized model