Description
|
| ||||||||||||||||||||||
| ||||||||||||||||||||||||||||||

# of Doses
8.00
Μodel
N50
6.85E+07
LD50/ID50
6.85E+07
Dose Units
Response
Exposure Route
Contains Preferred Model
a
2.21E-01
Agent Strain
EPEC B171-8 (serotype O11:NM)
Experiment ID
214, 216, 217
Host type
Experiment Dataset
Description
| ||||||||||||||||||||||
| ||||||||||||||||||||||||||||||
# of Doses
11.00
Μodel
N50
4.77E+02
LD50/ID50
4.77E+02
Dose Units
Response
Exposure Route
Contains Preferred Model
a
2.13E-01
Agent Strain
W294, 316c
Experiment ID
21,23
Host type
Experiment Dataset
Description
|
| ||||||||||||||||||||||
| ||||||||||||||||||||||||||||||

# of Doses
6.00
Μodel
N50
2.55E+02
LD50/ID50
2.55E+02
Dose Units
Response
Exposure Route
Contains Preferred Model
a
2.67E-01
Agent Strain
W294
Experiment ID
21
Host type
Experiment Dataset
Description
|
|
||||||||||||||||||||||
|
||||||||||||||||||||||||||||||||||||||
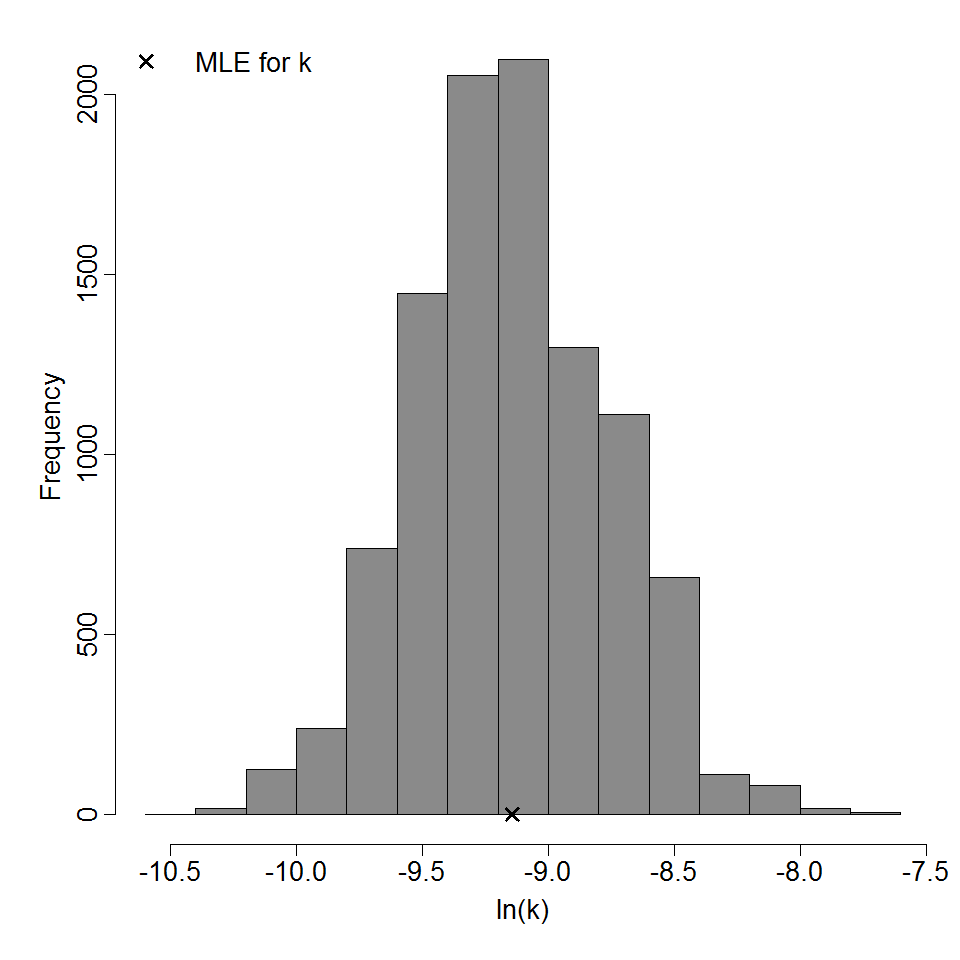
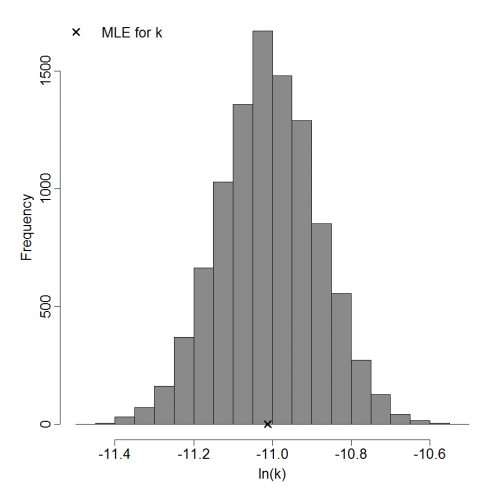
Parameter histogram for exponential model (uncertainty of the parameter)
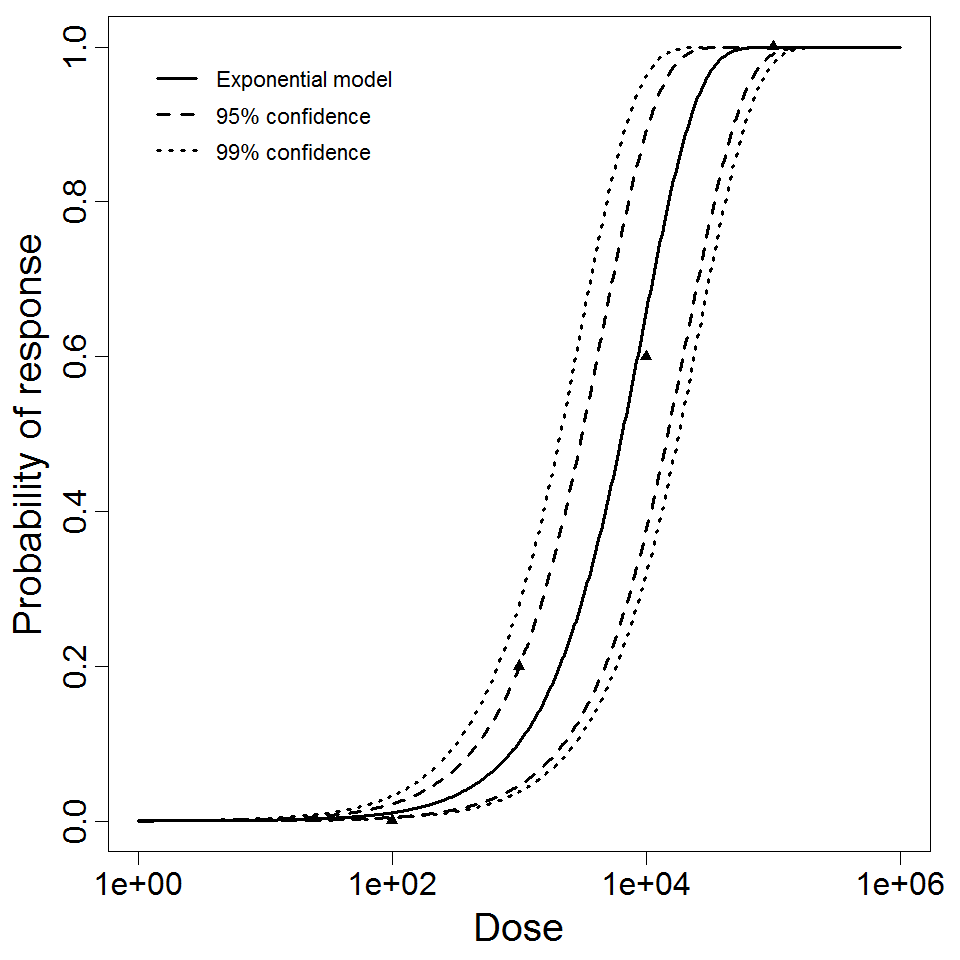
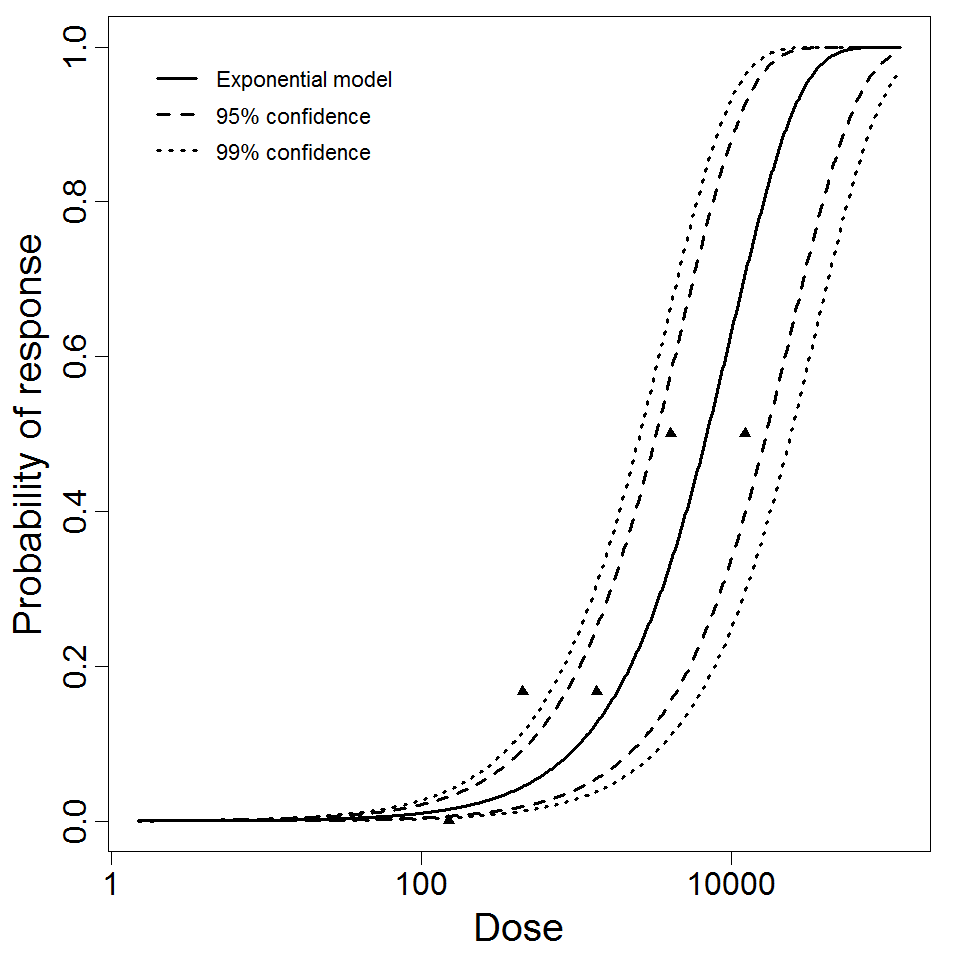
Exponential model plot, with confidence bounds around optimized model
# of Doses
4.00
Μodel
LD50/ID50
6.47E+03
Dose Units
Response
Exposure Route
Contains Preferred Model
k
1.07E-04
Agent Strain
KIM D27
Experiment ID
2
Host type
Description
|
|
||||||||||||||||||||||
|
||||||||||||||||||||||||||||||

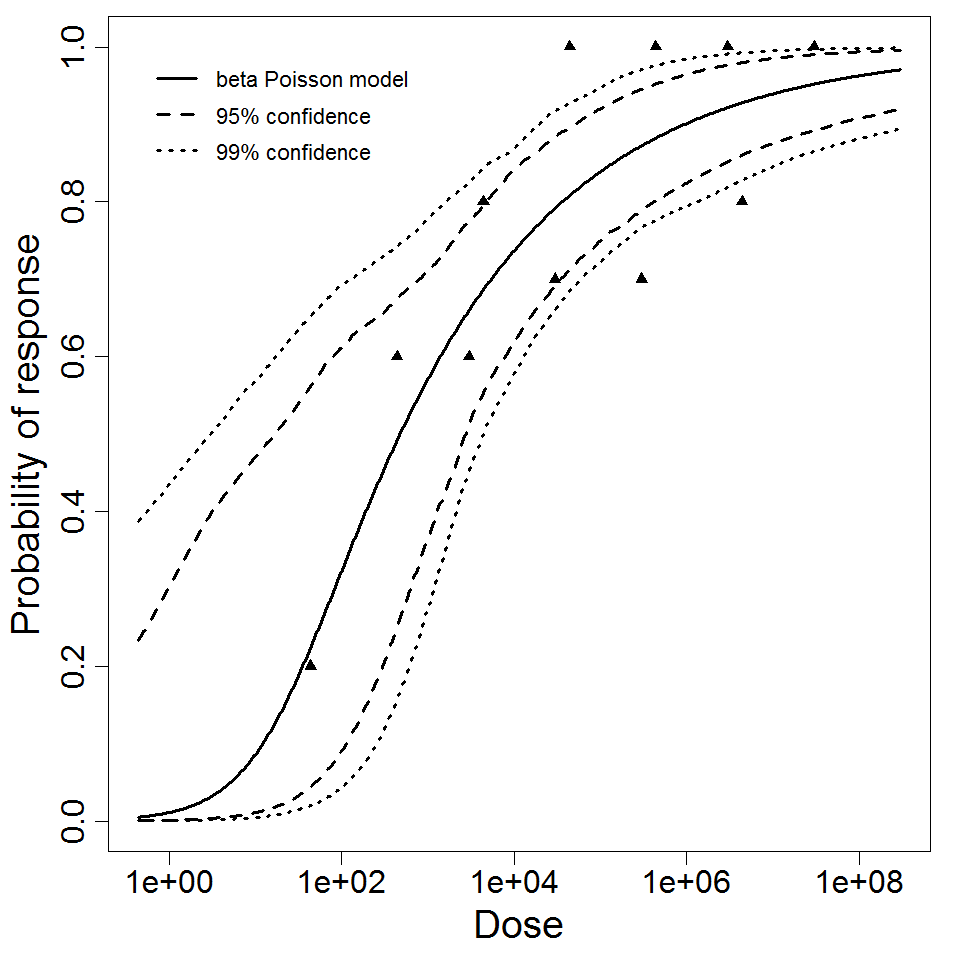
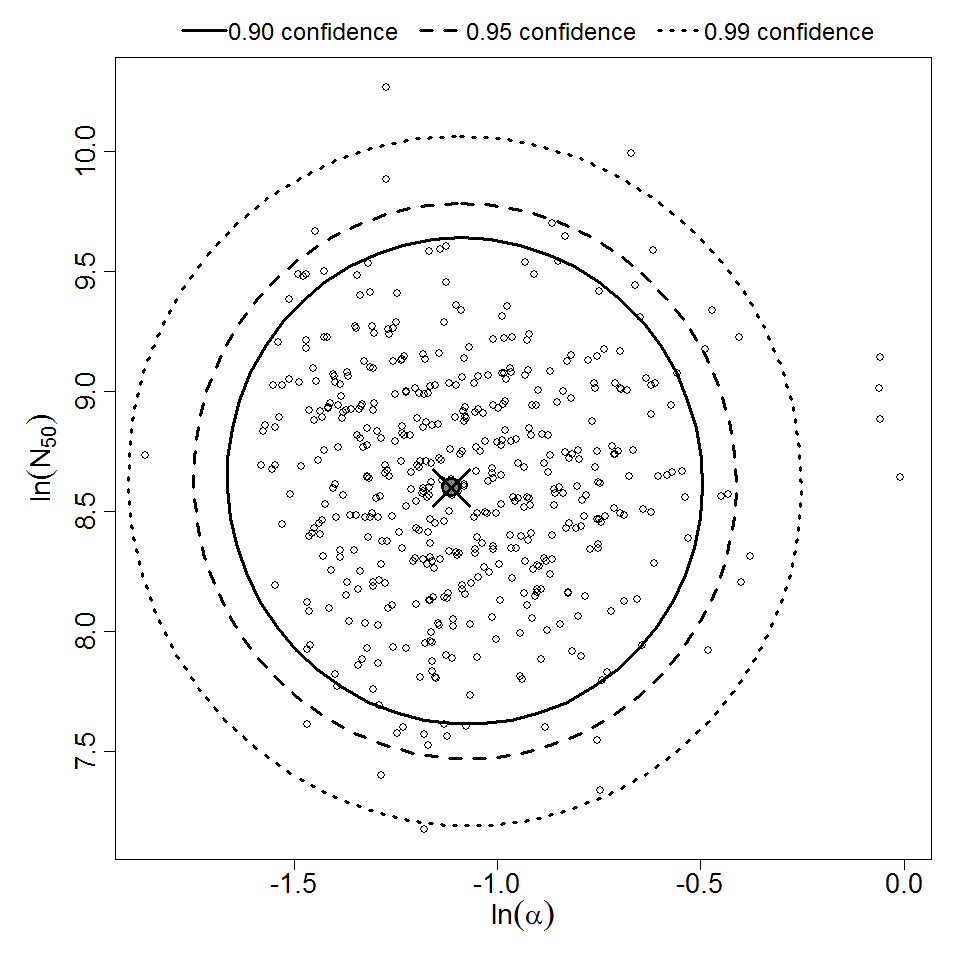
Parameter scatter plot for beta Poisson model ellipses signify the 0.9, 0.95 and 0.99 confidence of the parameters.

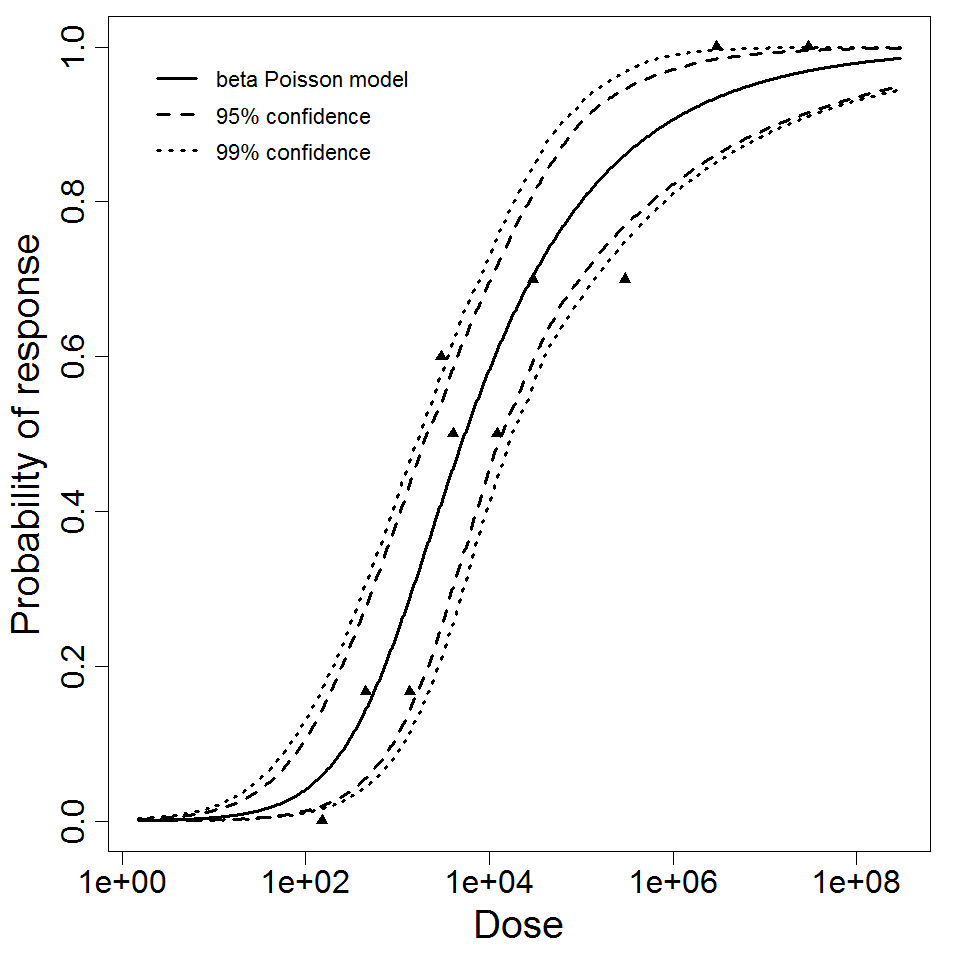
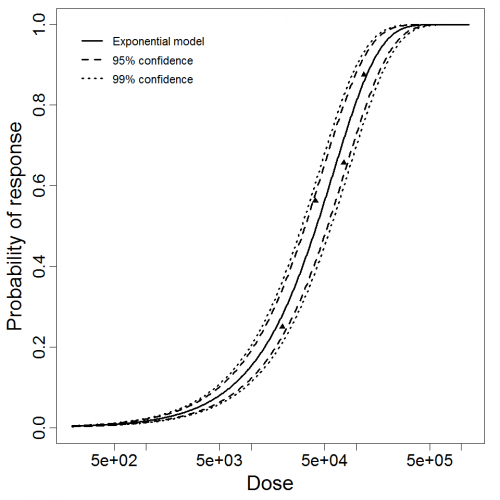
beta Poisson model plot, with confidence bounds around optimized model.
# of Doses
4.00
Μodel
N50
4.55E+02
LD50/ID50
4.55E+02
Dose Units
Response
Exposure Route
Contains Preferred Model
a
1.14E-01
Agent Strain
Moredun isolate
Experiment ID
183
Host type
Description
|
|
||||||||||||||||||||||
|
||||||||||||||||||||||||||||||
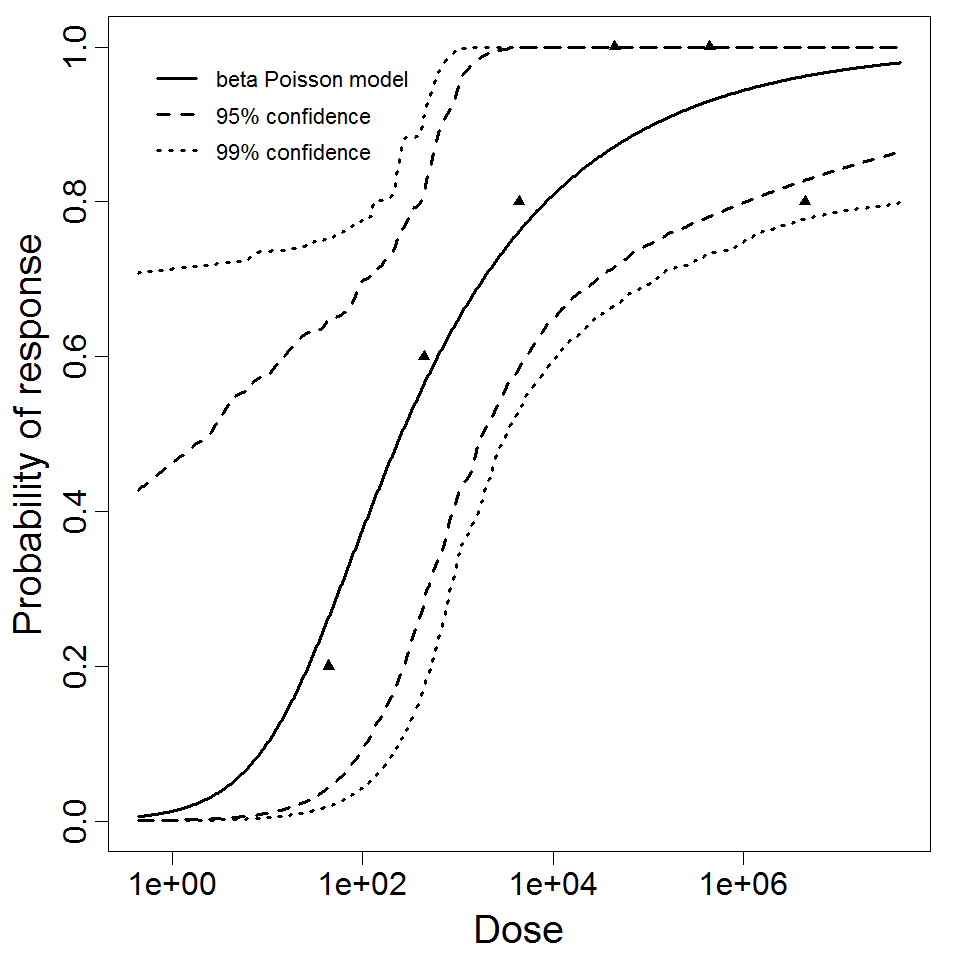
Parameter scatter plot for beta Poisson model ellipses signify the 0.9, 0.95 and 0.99 confidence of the parameters.
beta Poisson model plot, with confidence bounds around optimized model.
# of Doses
4.00
Μodel
N50
1.68E+01
LD50/ID50
1.68E+01
Dose Units
Response
Exposure Route
Contains Preferred Model
a
2.7E-01
Agent Strain
*C. hominis*, TU502
Experiment ID
181
Host type
Description
Optimization Output for experiment 18 and 23 pooled (B. pseudomallei)
|
| ||||||||||||||||||||||
| ||||||||||||||||||||||||||||||
# of Doses
10.00
Μodel
N50
5.43E+03
LD50/ID50
5.43E+03
Dose Units
Response
Contains Preferred Model
a
3.28E-01
Agent Strain
KHW,316c
Experiment ID
18,23
Host type
Experiment Dataset
Description
|
| ||||||||||||||||||||||
| ||||||||||||||||||||||||||||||||||||||

# of Doses
5.00
Μodel
LD50/ID50
6.92E+03
Dose Units
Response
Exposure Route
Contains Preferred Model
k
1.00E-04
Agent Strain
KHW
Experiment ID
18
Host type
Experiment Dataset
Description
|
| ||||||||||||||||||||||
| ||||||||||||||||||||||||||||||||||||||
# of Doses
5.00
Μodel
LD50/ID50
6.63E+01
Dose Units
Response
Exposure Route
Contains Preferred Model
k
1.04E-02
Agent Strain
KHW
Experiment ID
17
Host type
Experiment Dataset
Description
|
|
||||||||||||||||||||||
|
||||||||||||||||||||||||||||||
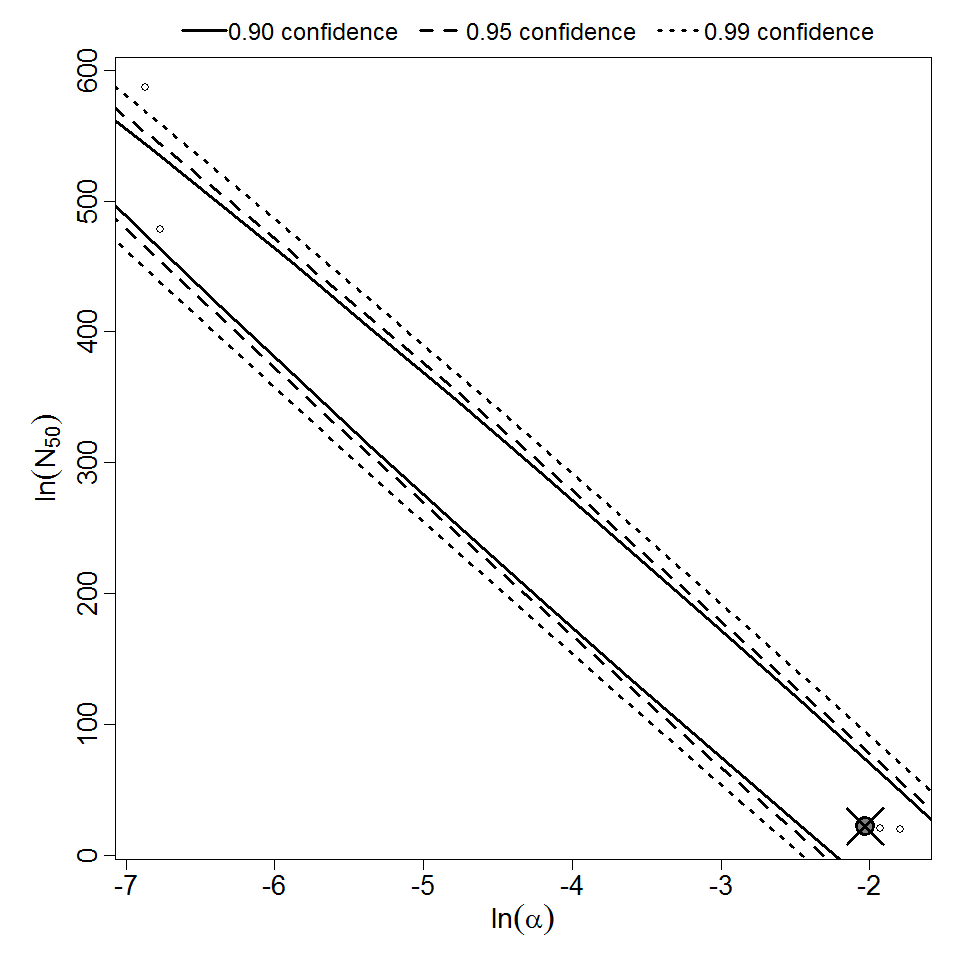
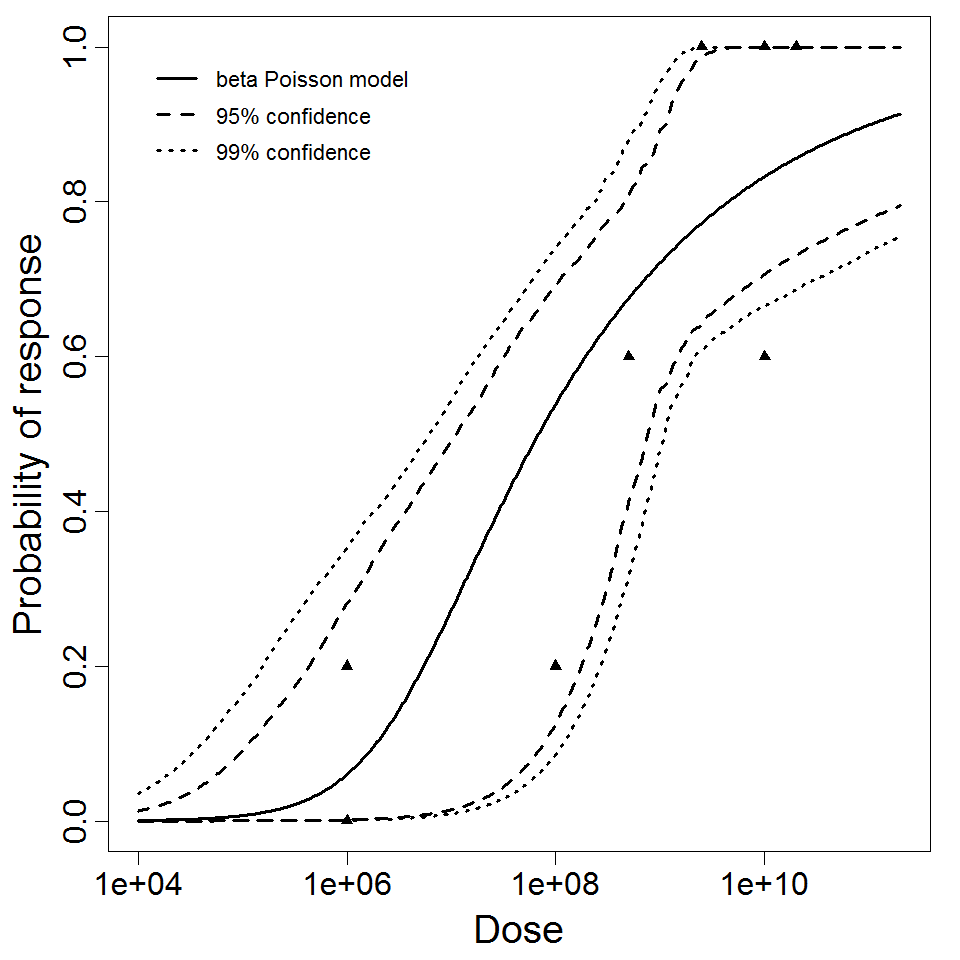
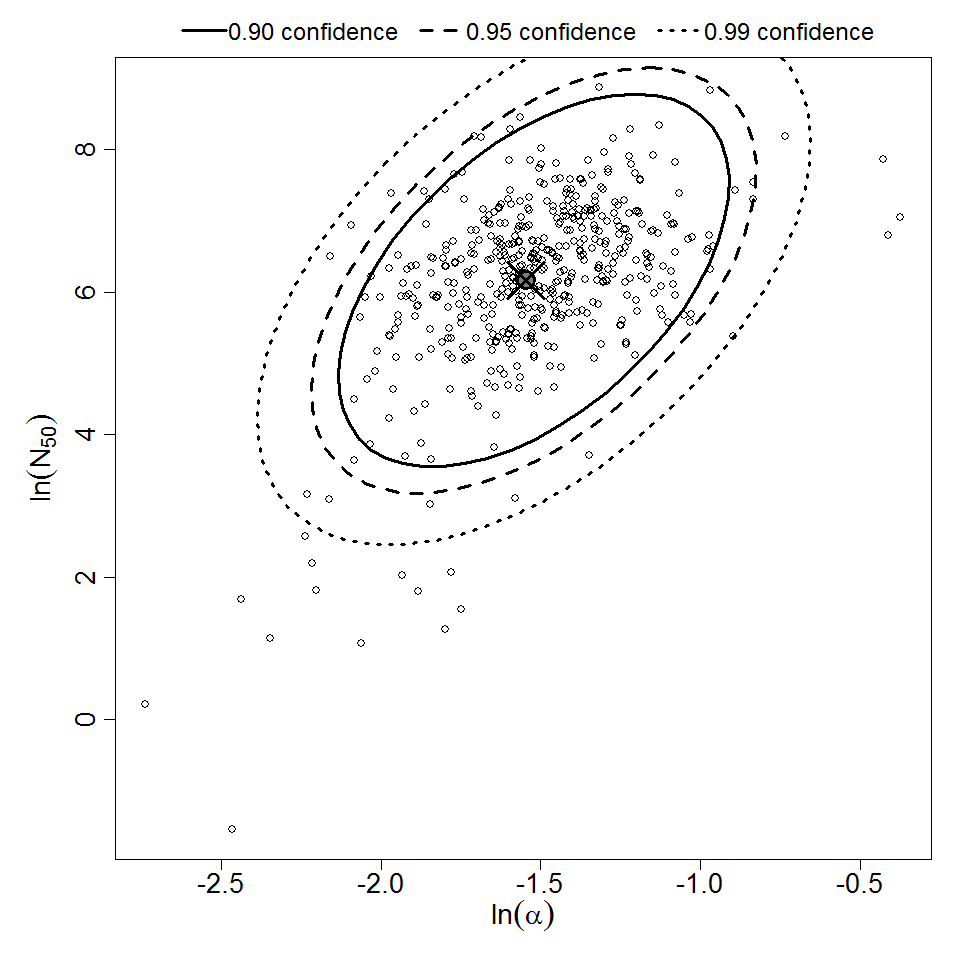
Parameter scatter plot for beta Poisson model ellipses signify the 0.9, 0.95 and 0.99 confidence of the parameters.

beta Poisson model plot, with confidence bounds around optimized model
# of Doses
7.00
Μodel
N50
2.91E+09
LD50/ID50
2.91E+09
Dose Units
Response
Exposure Route
Contains Preferred Model
a
1.31E-01
Agent Strain
Inaba 569B (classical)
Experiment ID
167
Host type