|
|
||||||||||||||||||||||
|
||||||||||||||||||||||||||||||||||||||
Parameter histogram for exponential model (uncertainty of the parameter)
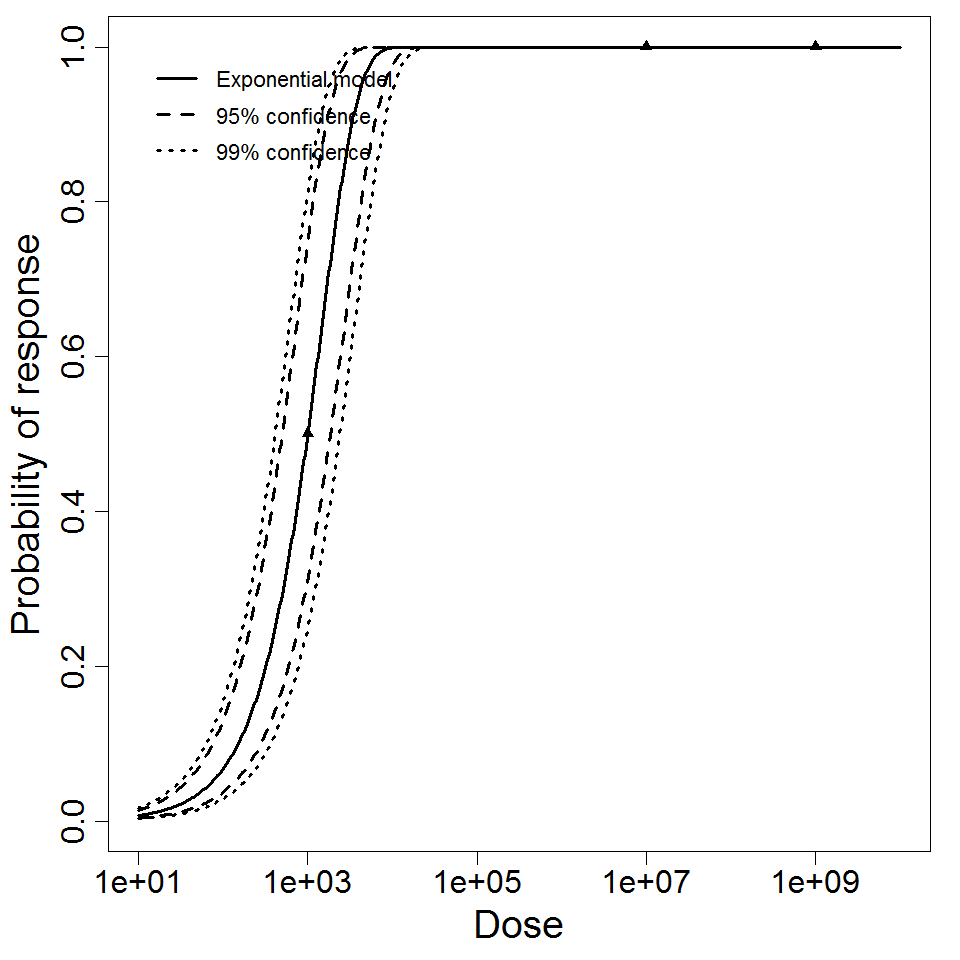
Exponential model plot, with confidence bounds around optimized model
|
|
||||||||||||||||||||||
|
||||||||||||||||||||||||||||||
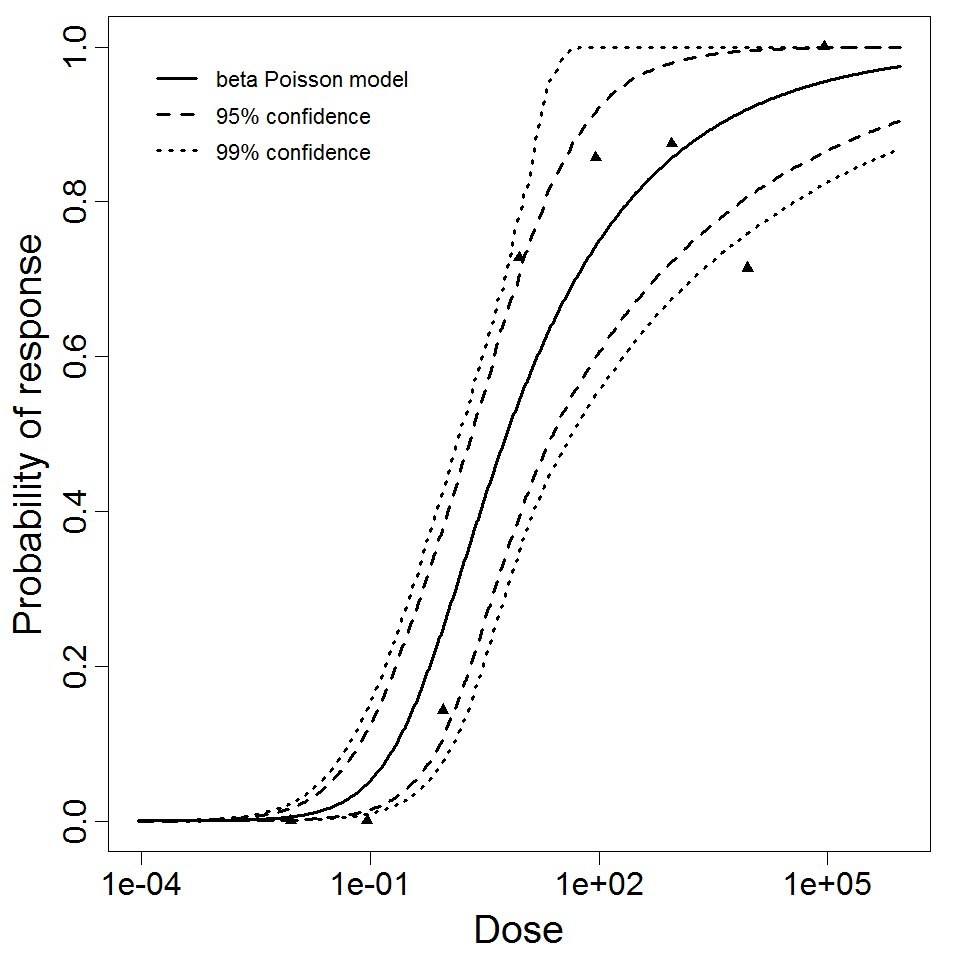
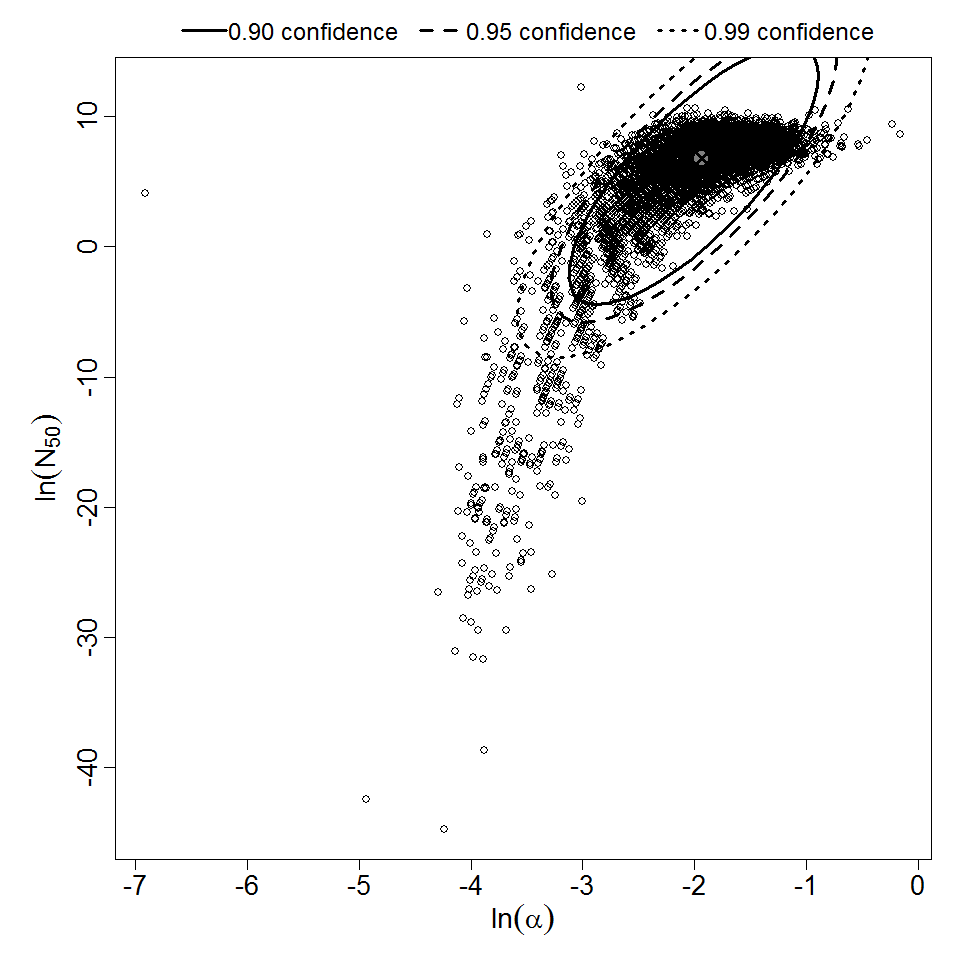
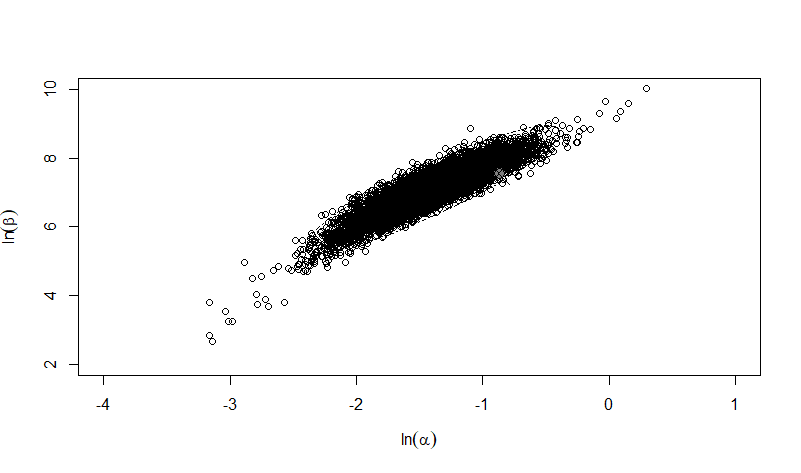
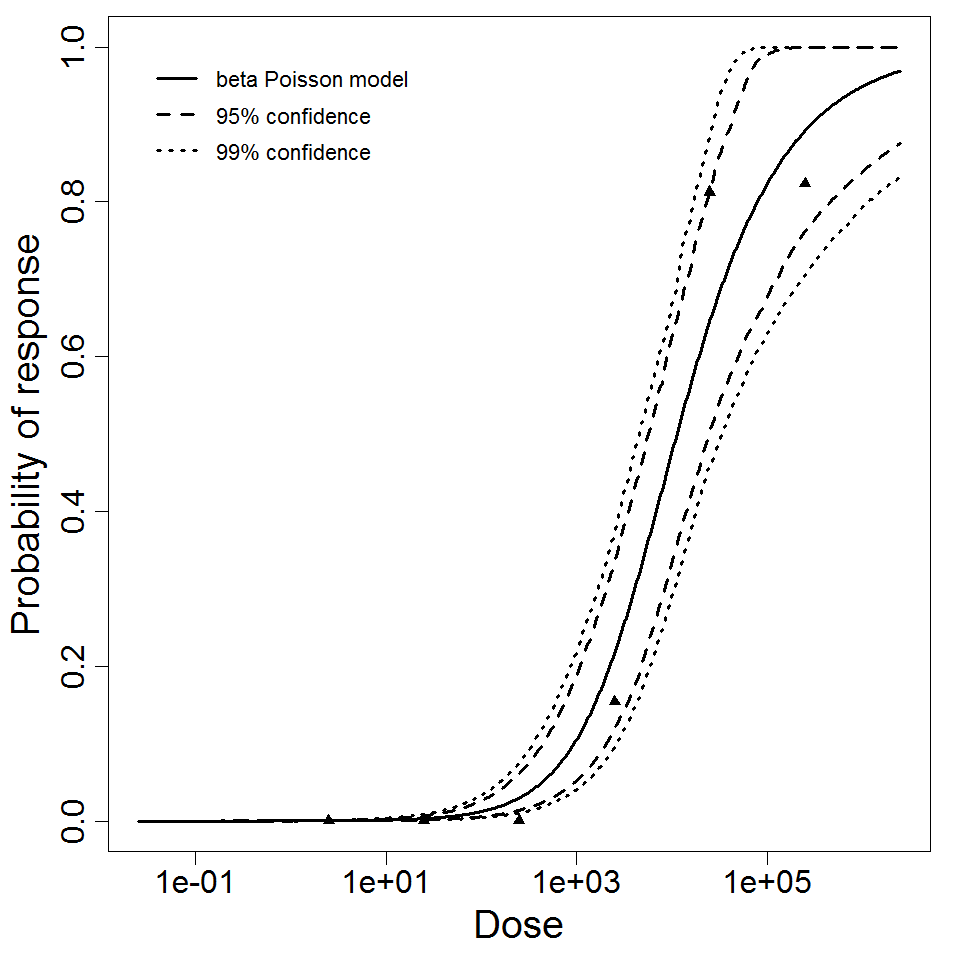
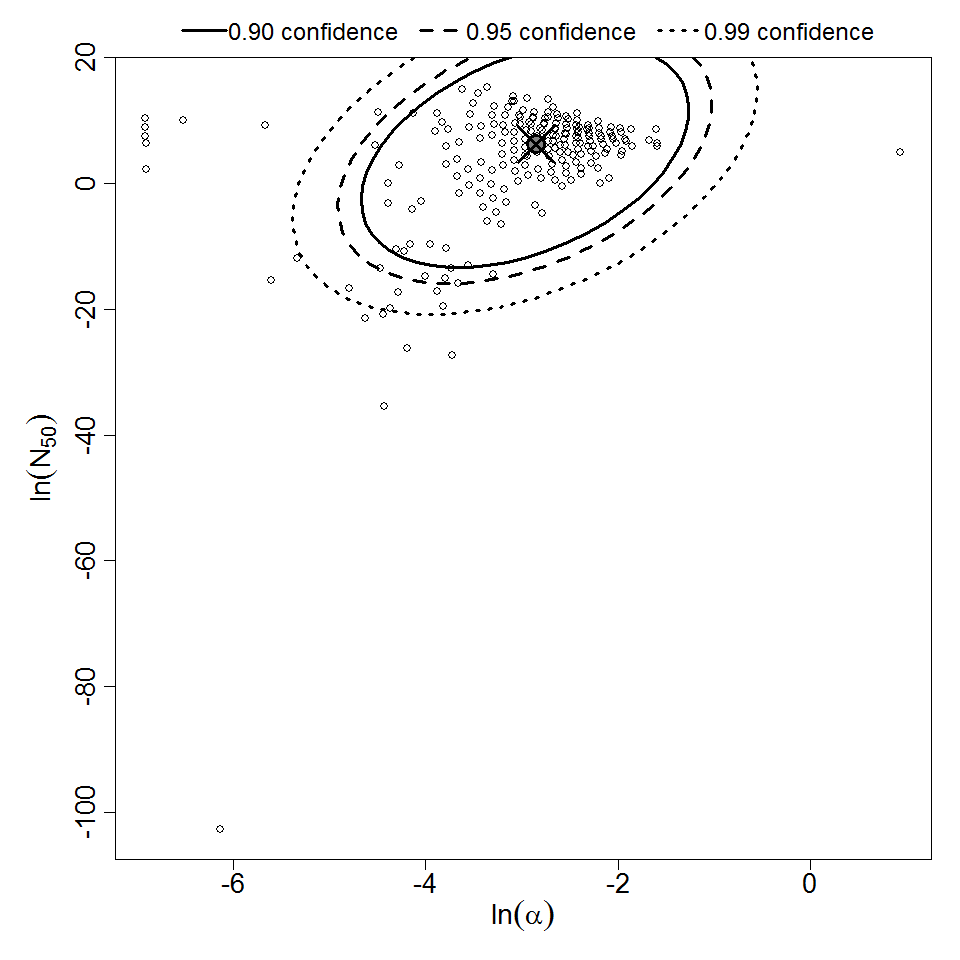
Parameter scatter plot for beta Poisson model ellipses signify the 0.9, 0.95 and 0.99 confidence of the parameters.
beta Poisson model plot, with confidence bounds around optimized model
The same exposure route and endpoint was evaluated for Experiments 3 and 4 (Cerva, 1967b; Culbertson et al. 1966)[6] [5]. A pooling analysis was attempted and successful. The beta-Poisson model provided a good fit to the pooled data and is shown below in Figure 1. Note: both the exact and approximate beta-Poisson models were fit to the data. The figures shown below and the csv file of bootstrapped parameter replicates are for the best fitting parameters of the exact beta-Poisson model. The successful pooling of multiple datasets generally increases the confidence in the estimated model parameters.
[6] Cerva, L. (1967b). Intranasal, Intrapulmonary, and Intracardial Inoculation of Experimental Animals with Hartmanella castellanii. Folia Parasitologica (Praha), 14, 207–215.
[5] Culbertson, C. G., Ensminger, P. W., & Overton, W. M. (1966). Hartmannella (Acanthamoeba): Experimental Chronic, Granulomatous Brain Infections Produced by New Isolates of Low Virulence. The American Journal of Clinical Pathology, 46(3), 305–314.
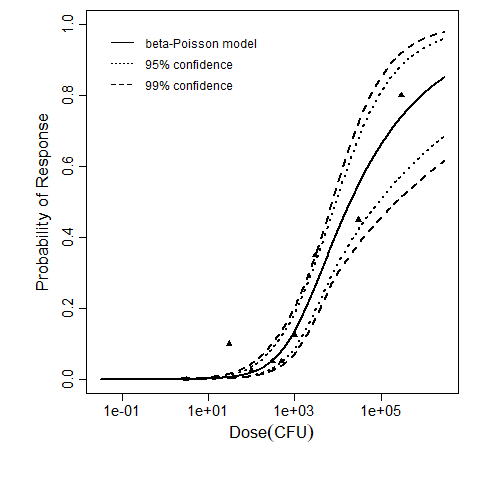
Badenoch et al. (1990) studied the combined effect of Acanthamoeba Ac118 (a group III isolate) and the bacterium Corynebacterium xerosis on the corneas of female Porton rats. A constant dose of 104 C. xerosis with increasing doses of Acanthamoeba spp. were injected into incisions in the rat corneas using a microsyringe (Badenoch et al. 1990).
The exponential model provided the best fit to the data.


| Dose (no. of organisms) | Positive Responses | Negative Responses | Total Subjects/Responses | |
|---|---|---|---|---|
| 10 | 0 | 8 | 8 | |
| 100 | 0 | 16 | 16 | |
| 1000 | 2 | 16 | 18 | |
| 10000 | 5 | 3 | 8 |
|
||||||||||||||||||||||
|
||||||||||||||||||||||||||||||
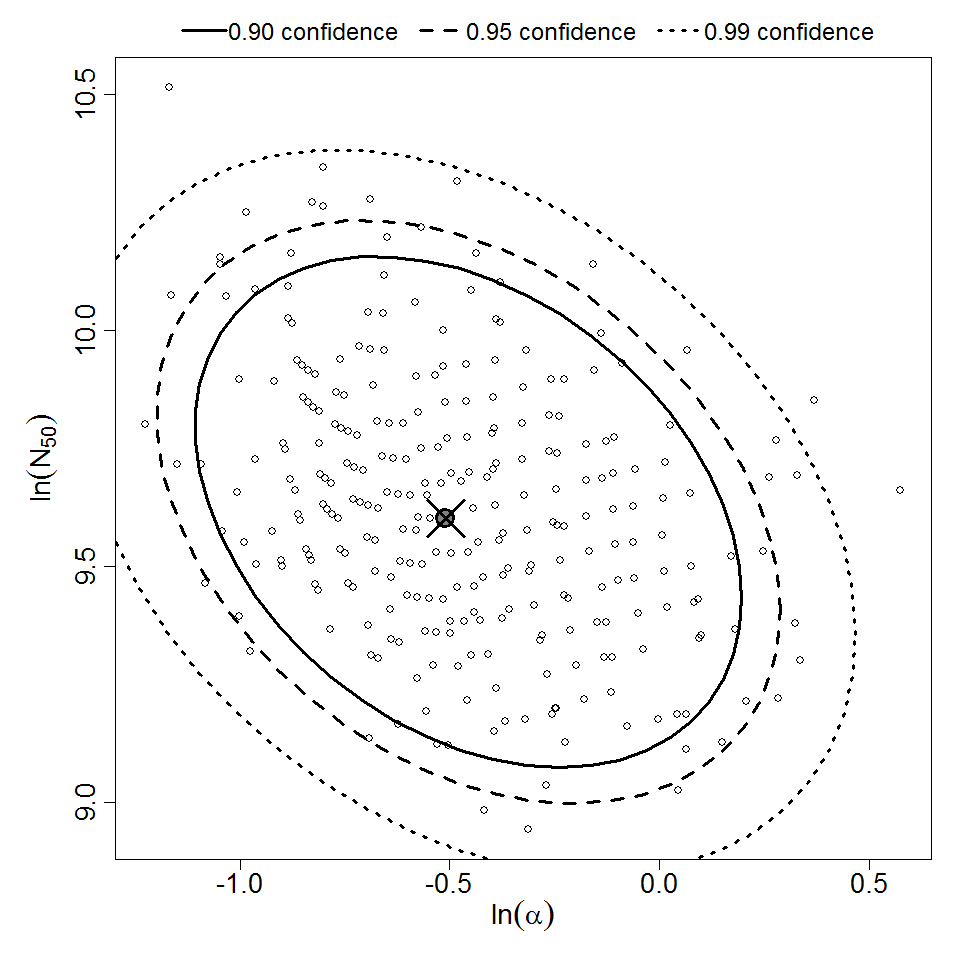
Parameter scatter plot for beta Poisson model ellipses signify the 0.9, 0.95 and 0.99 confidence of the parameters.
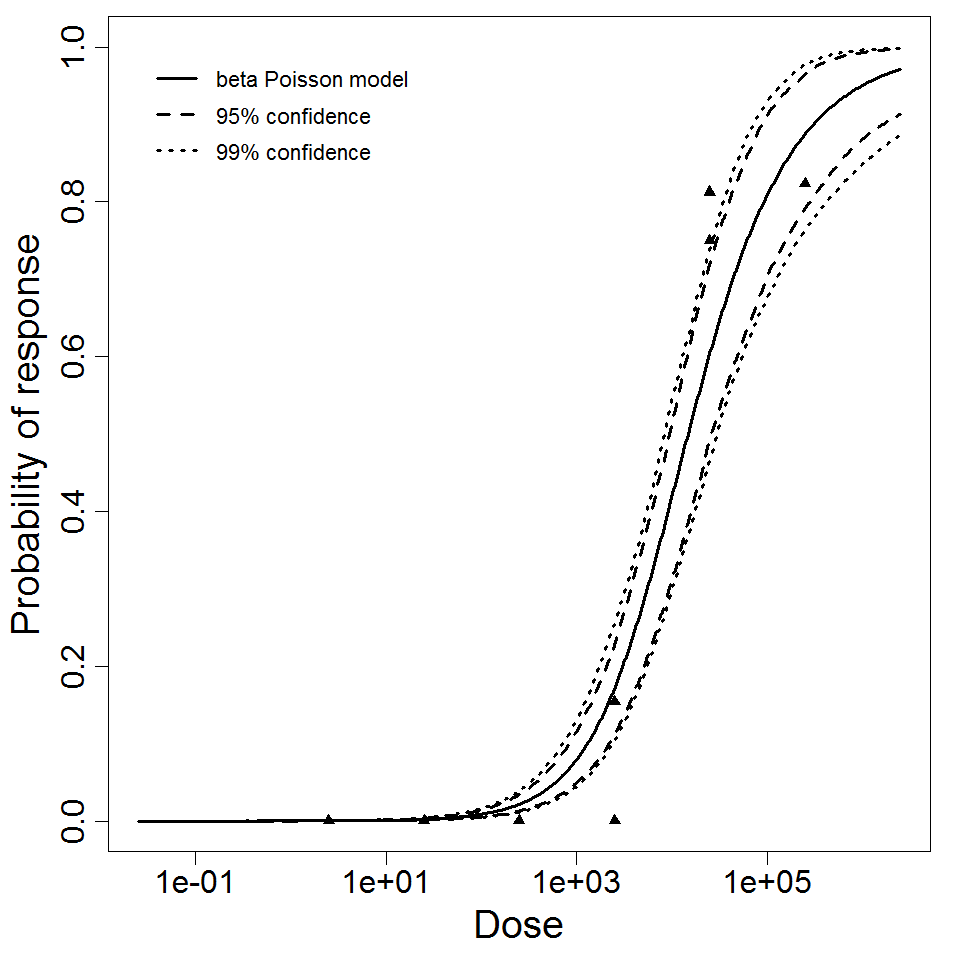
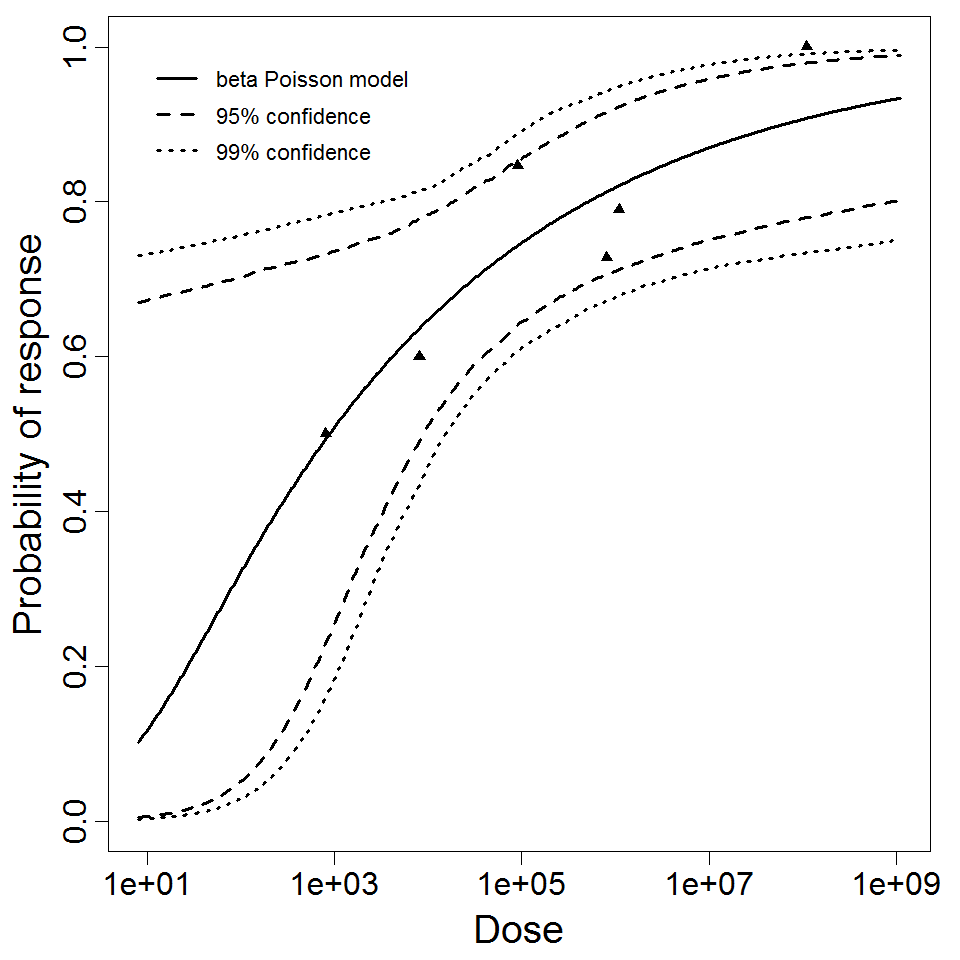
beta Poisson model plot, with confidence bounds around optimized model
|
|
||||||||||||||||||||||
|
||||||||||||||||||||||||||||||
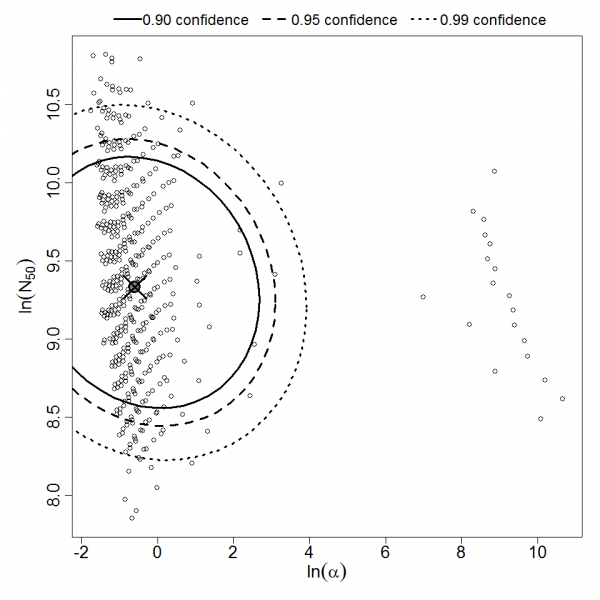
Parameter scatter plot for beta Poisson model ellipses signify the 0.9, 0.95 and 0.99 confidence of the parameters.
beta Poisson model plot, with confidence bounds around optimized model
|
|
||||||||||||||||||||||
|
||||||||||||||||||||||||||||||
Parameter scatter plot for beta Poisson model ellipses signify the 0.9, 0.95 and 0.99 confidence of the parameters.

beta Poisson model plot, with confidence bounds around optimized model
|
|
||||||||||||||||||||||
|
||||||||||||||||||||||||||||||||||||||
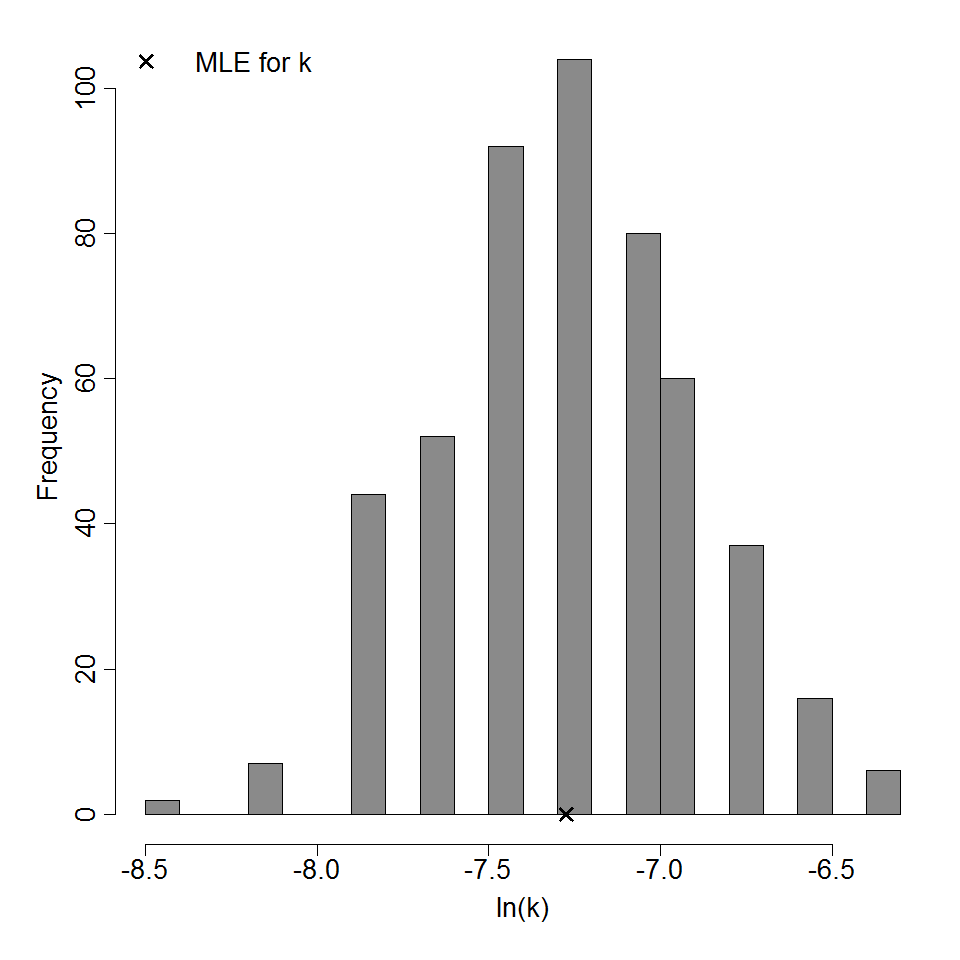
Parameter histogram for exponential model (uncertainty of the parameter)
Exponential model plot, with confidence bounds around optimized model
|
| ||||||||||||||||||||||
| ||||||||||||||||||||||||||||||