|
|
||||||||||||||||||||||
|
||||||||||||||||||||||||||||||||||||||
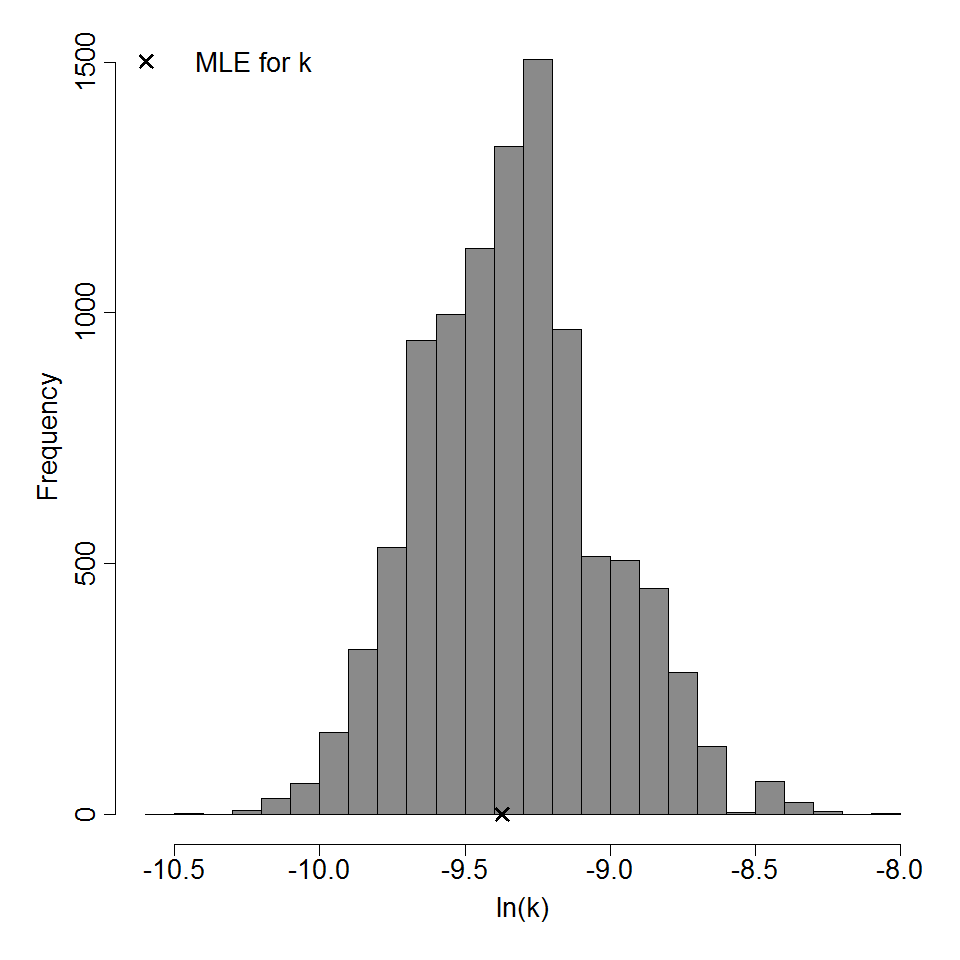
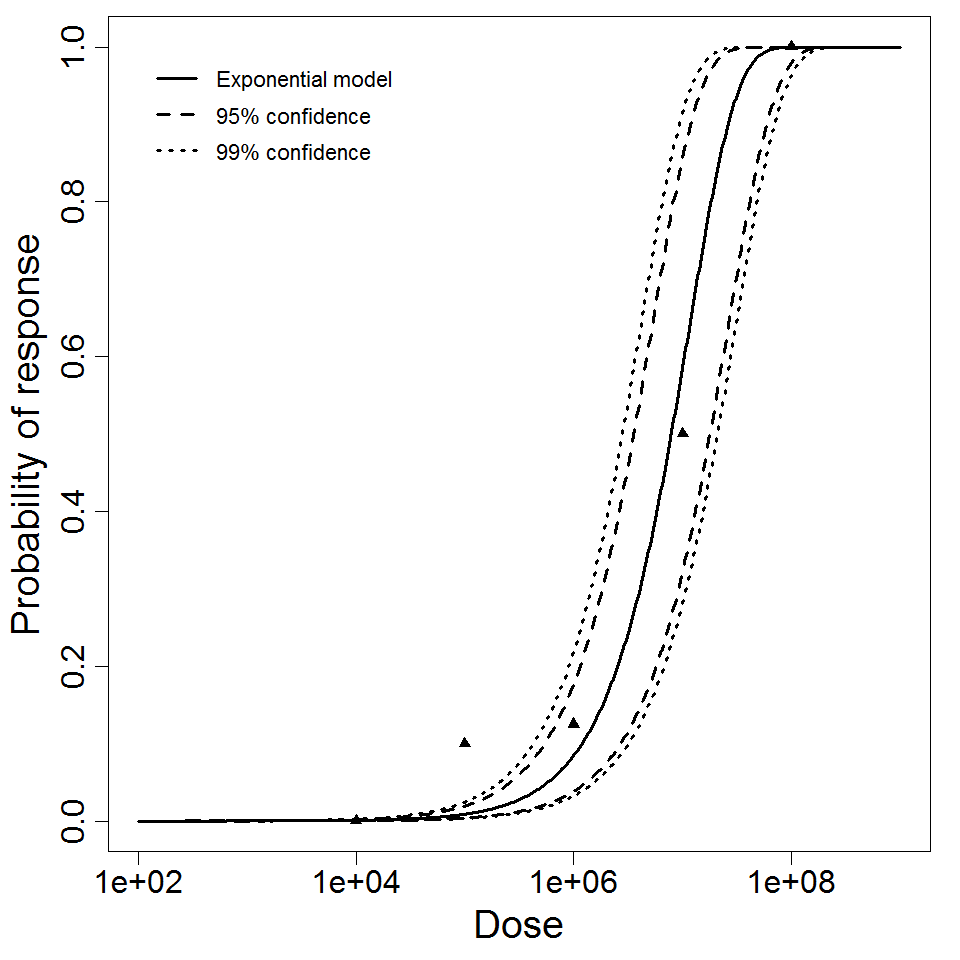
Parameter histogram for exponential model (uncertainty of the parameter)
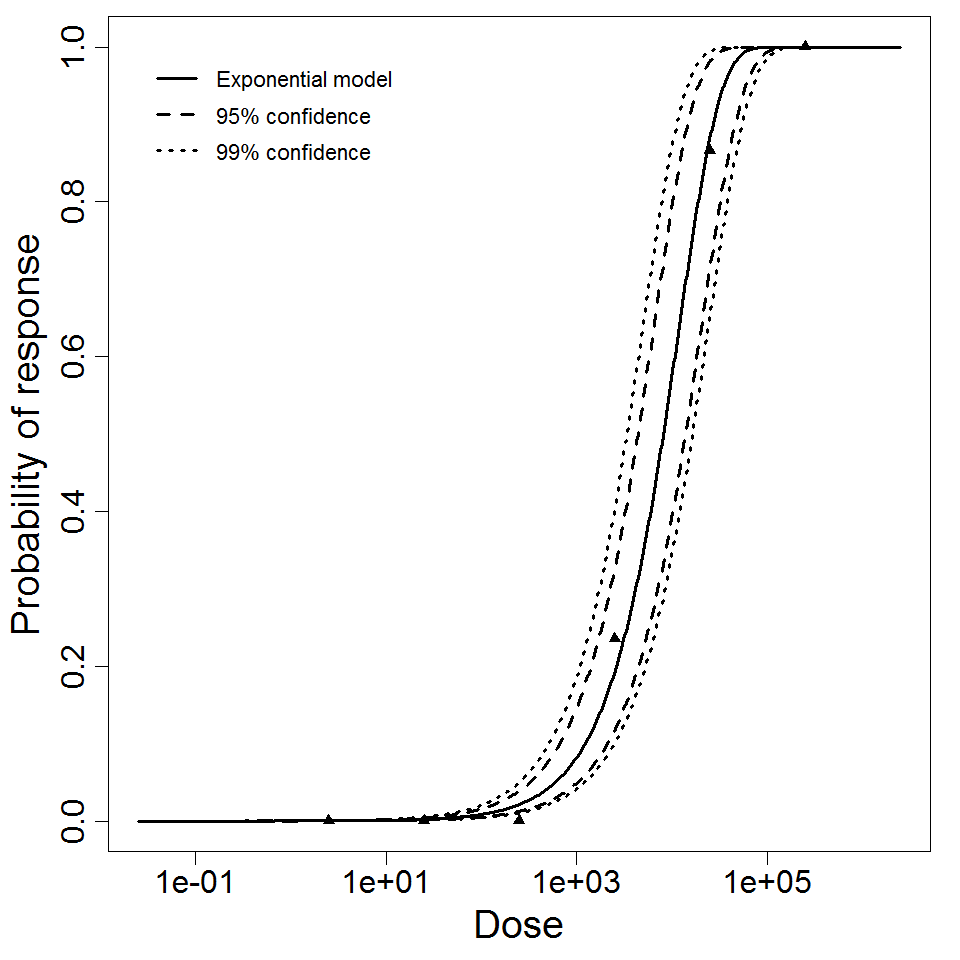
Exponential model plot, with confidence bounds around optimized model
|
|
||||||||||||||||||||||
|
||||||||||||||||||||||||||||||||||||||
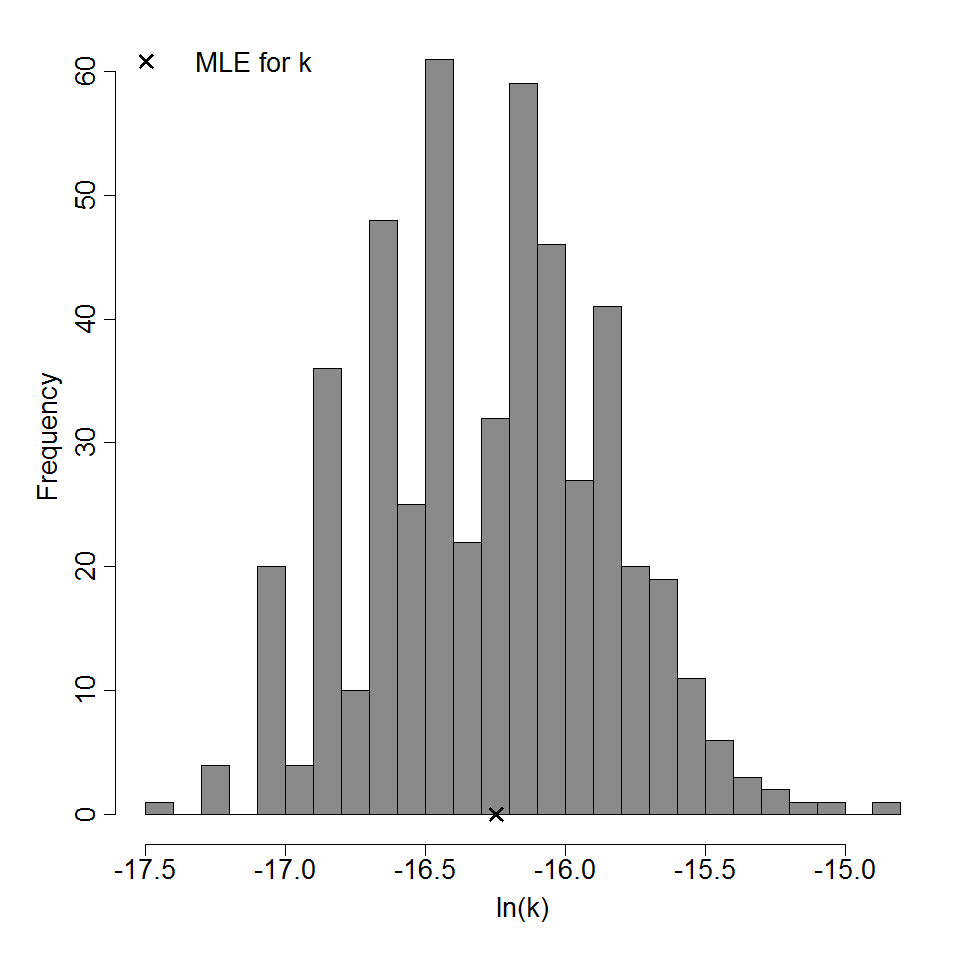
Parameter histogram for exponential model (uncertainty of the parameter)
Exponential model plot, with confidence bounds around optimized model
|
|
||||||||||||||||||||||
|
||||||||||||||||||||||||||||||
Parameter histogram for exponential model (uncertainty of the parameter)
Exponential model plot, with confidence bounds around optimized model
|
|
||||||||||||||||||||||
|
||||||||||||||||||||||||||||||

Parameter histogram for exponential model (uncertainty of the parameter)
Exponential model plot, with confidence bounds around optimized model
|
||||||||||||||||||||||
|
||||||||||||||||||||||||||||||||||||||
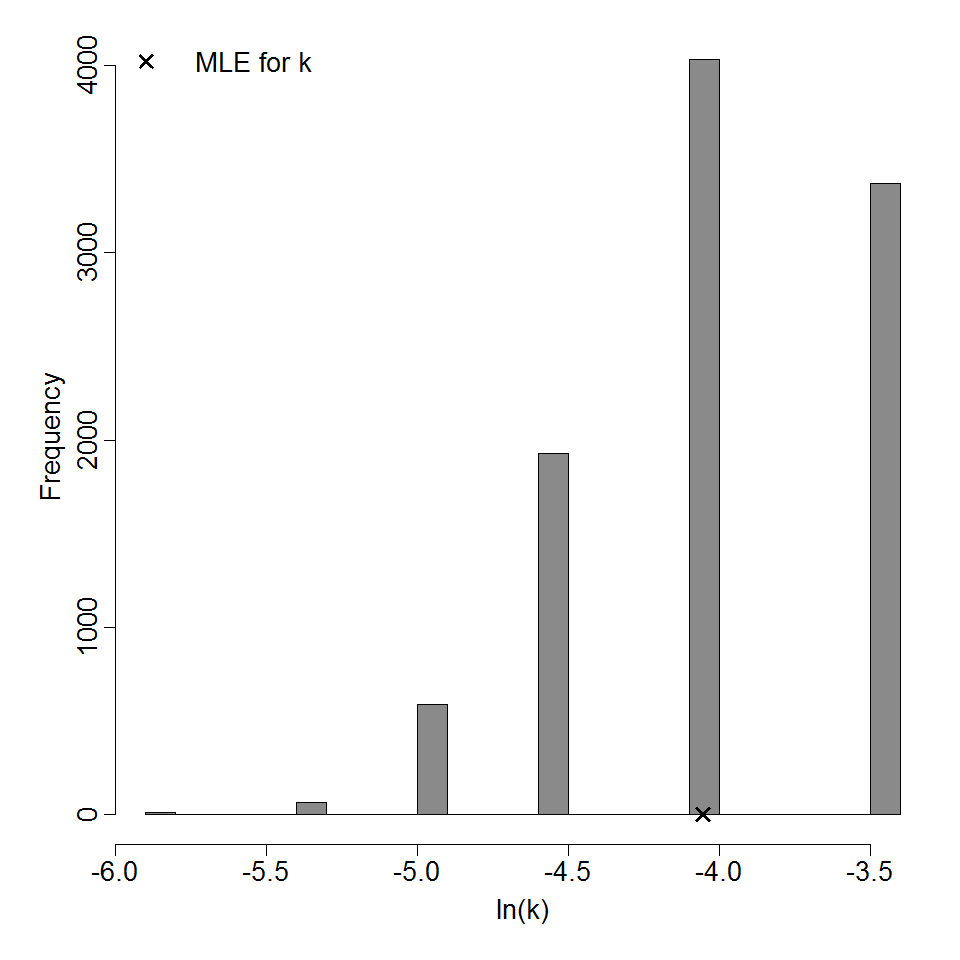
Parameter histogram for exponential model (uncertainty of the parameter)
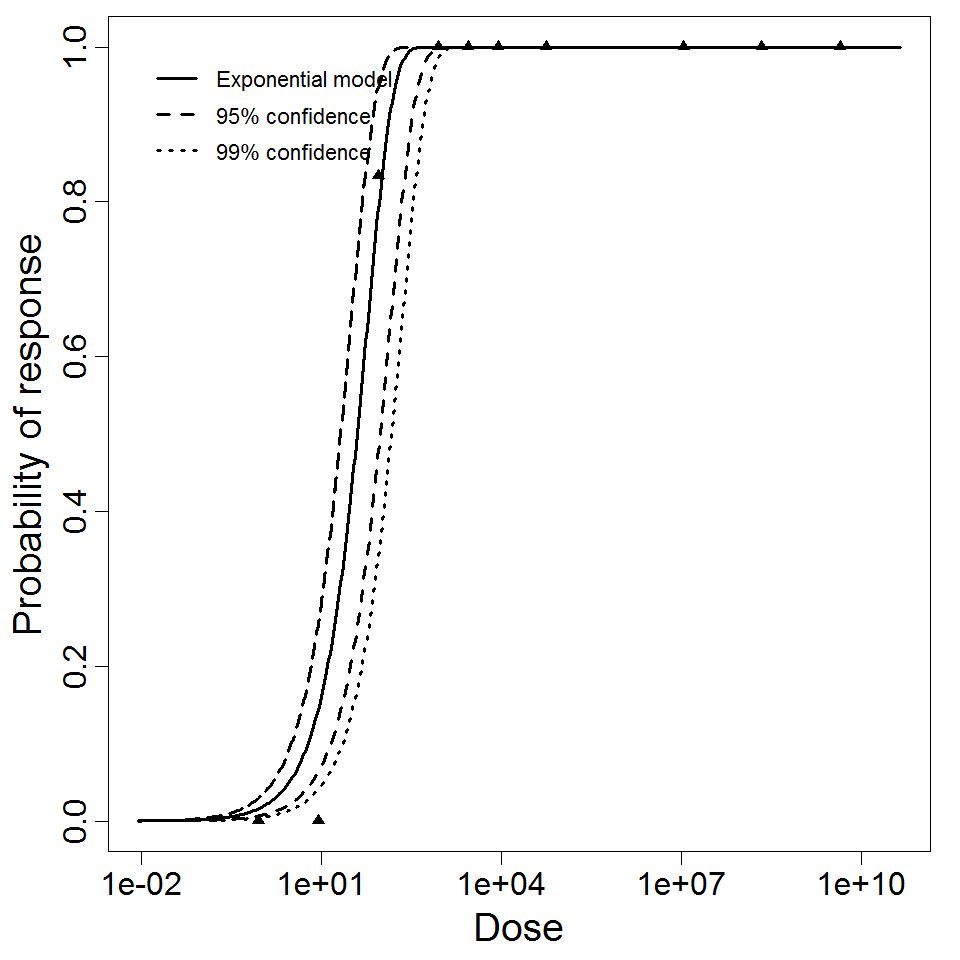
Exponential model plot, with confidence bounds around optimized model
|
| ||||||||||||||||||||||
| ||||||||||||||||||||||||||||||

|
|
||||||||||||||||||||||
|
||||||||||||||||||||||||||||||
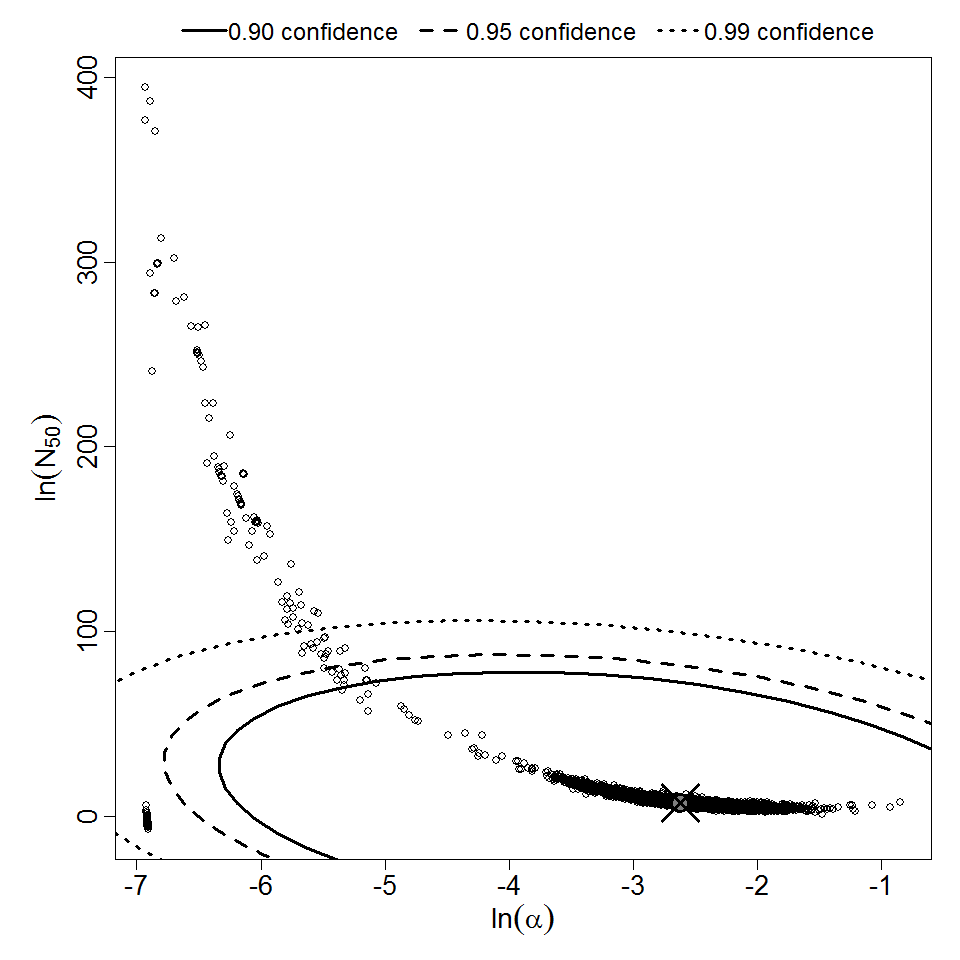
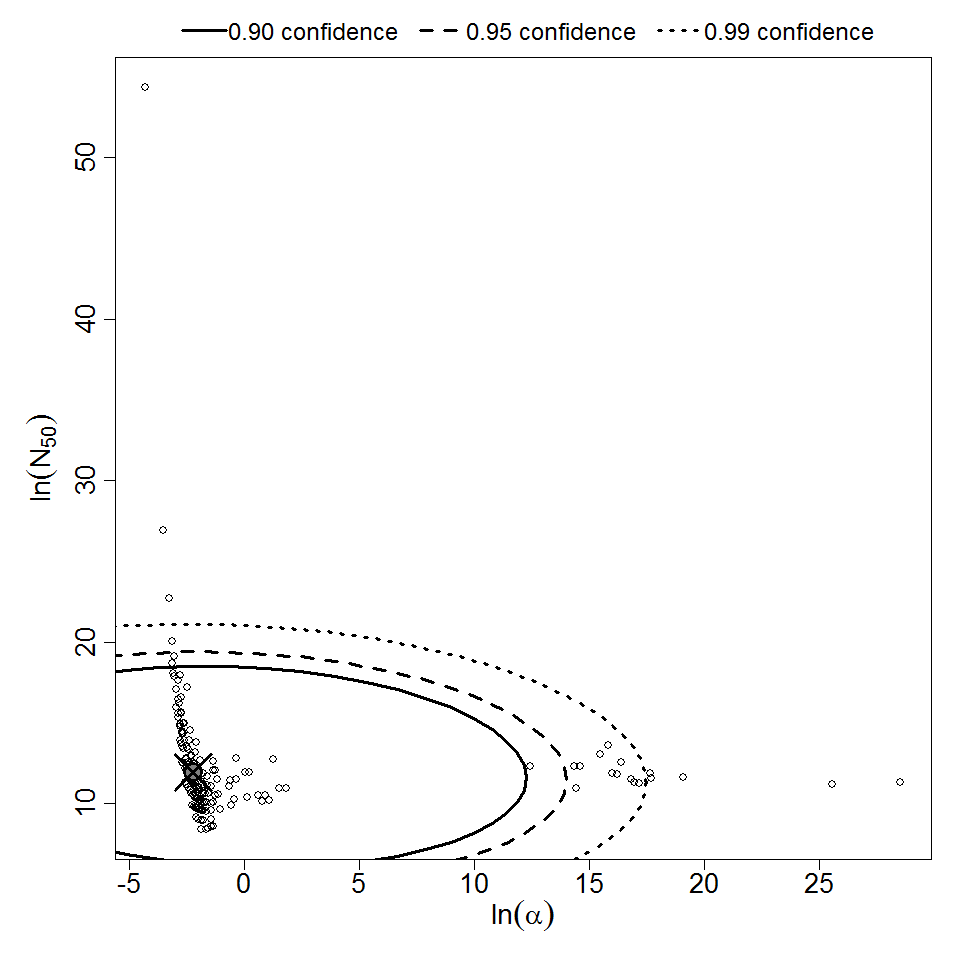
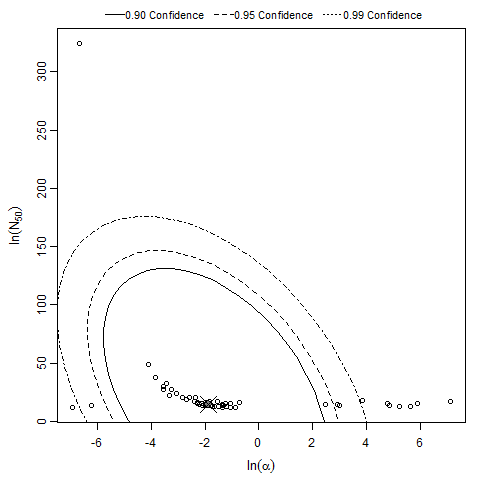
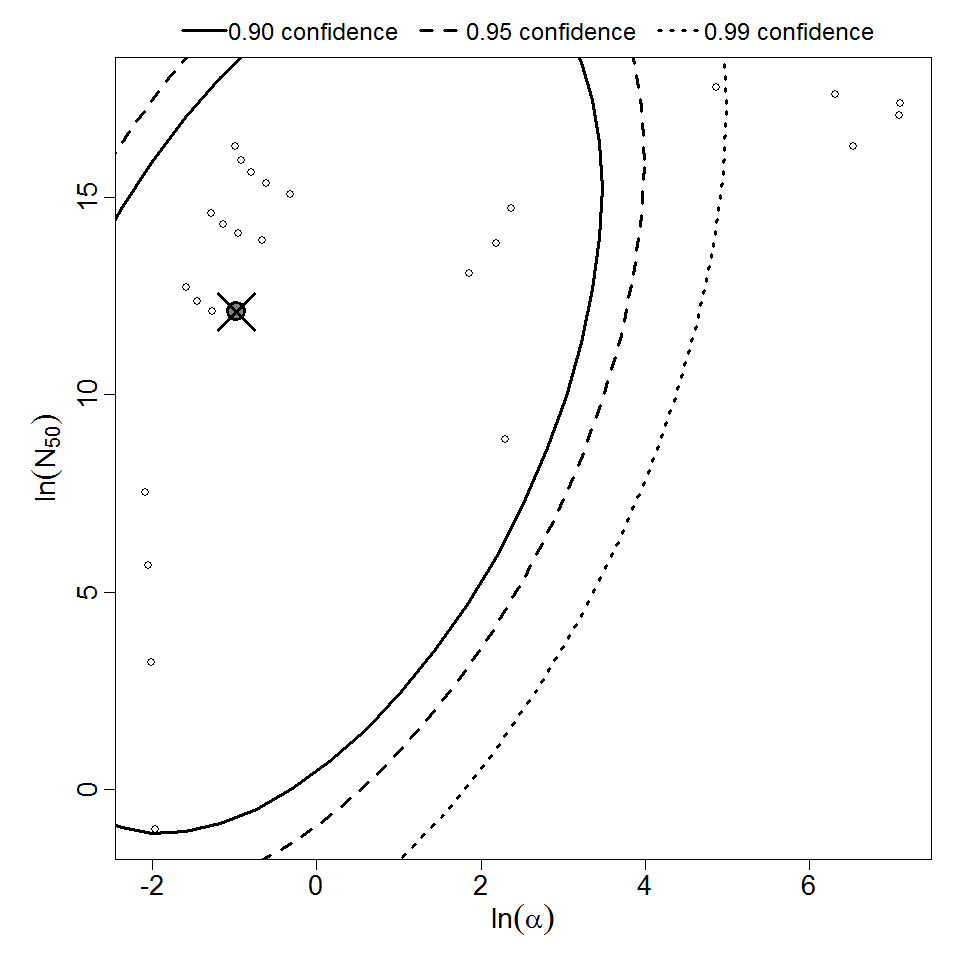
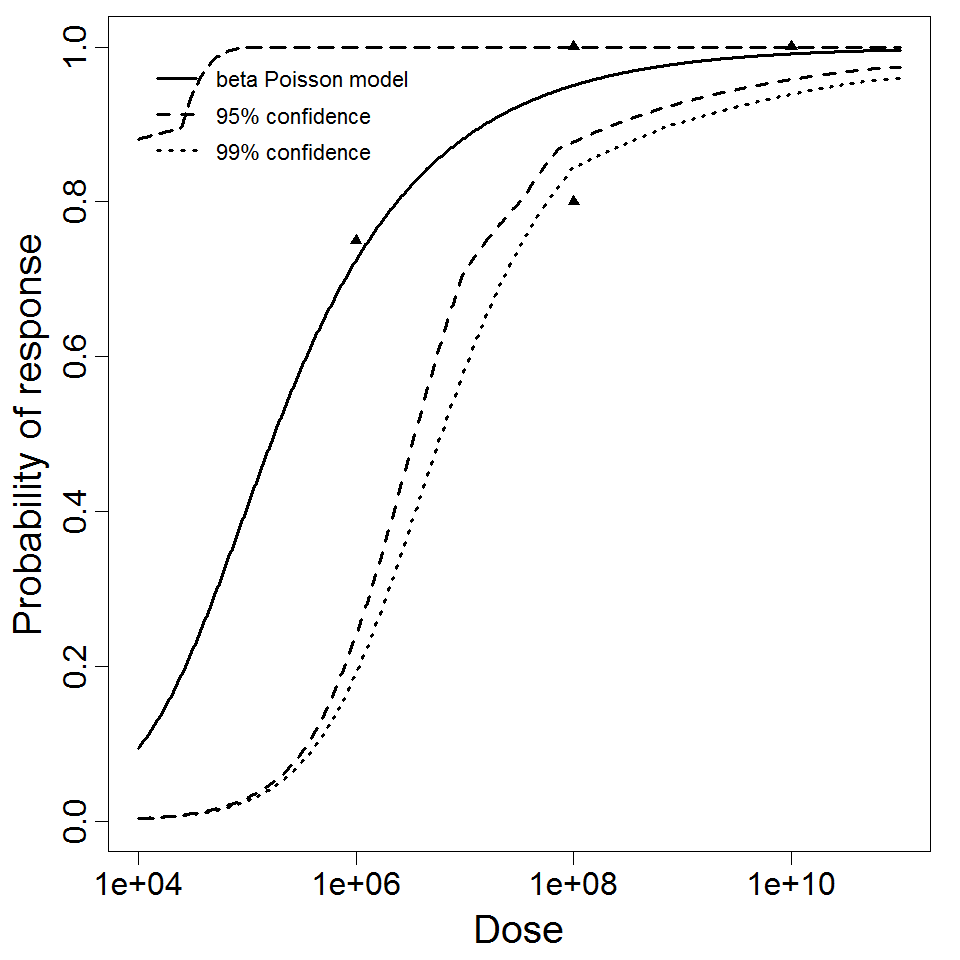
Parameter scatter plot for beta Poisson model ellipses signify the 0.9, 0.95 and 0.99 confidence of the parameters.
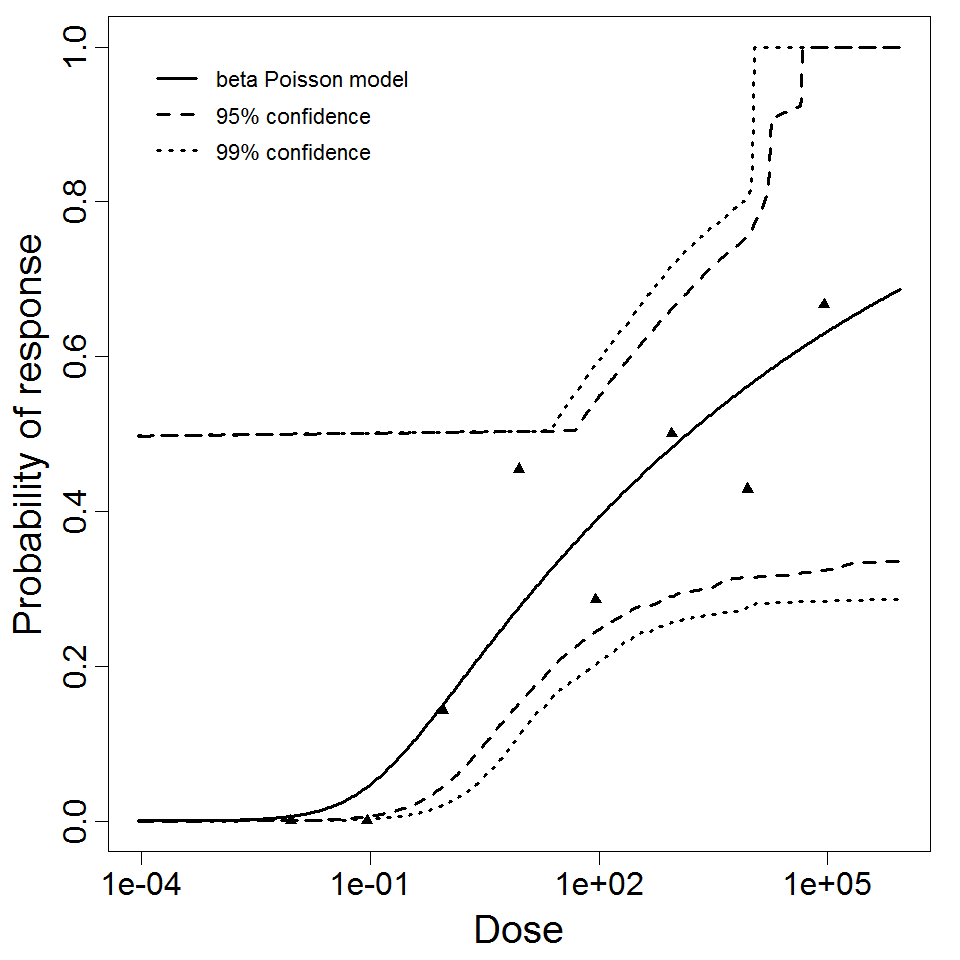
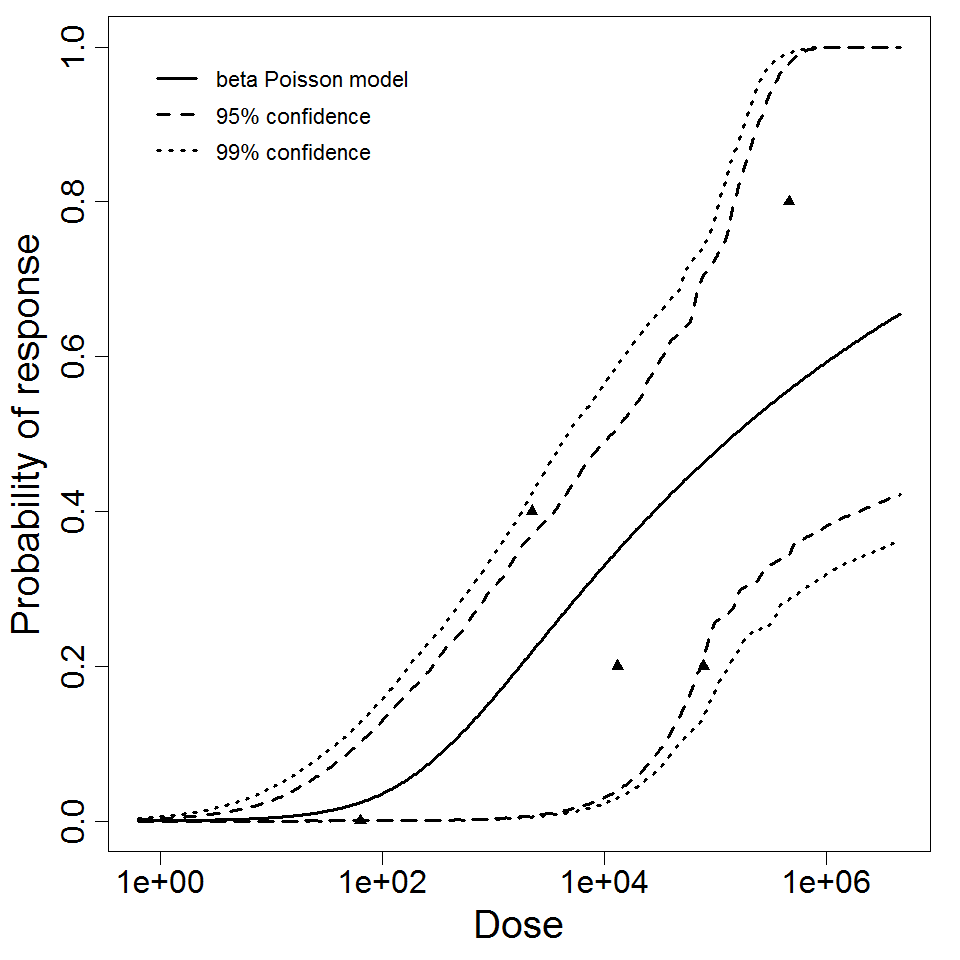
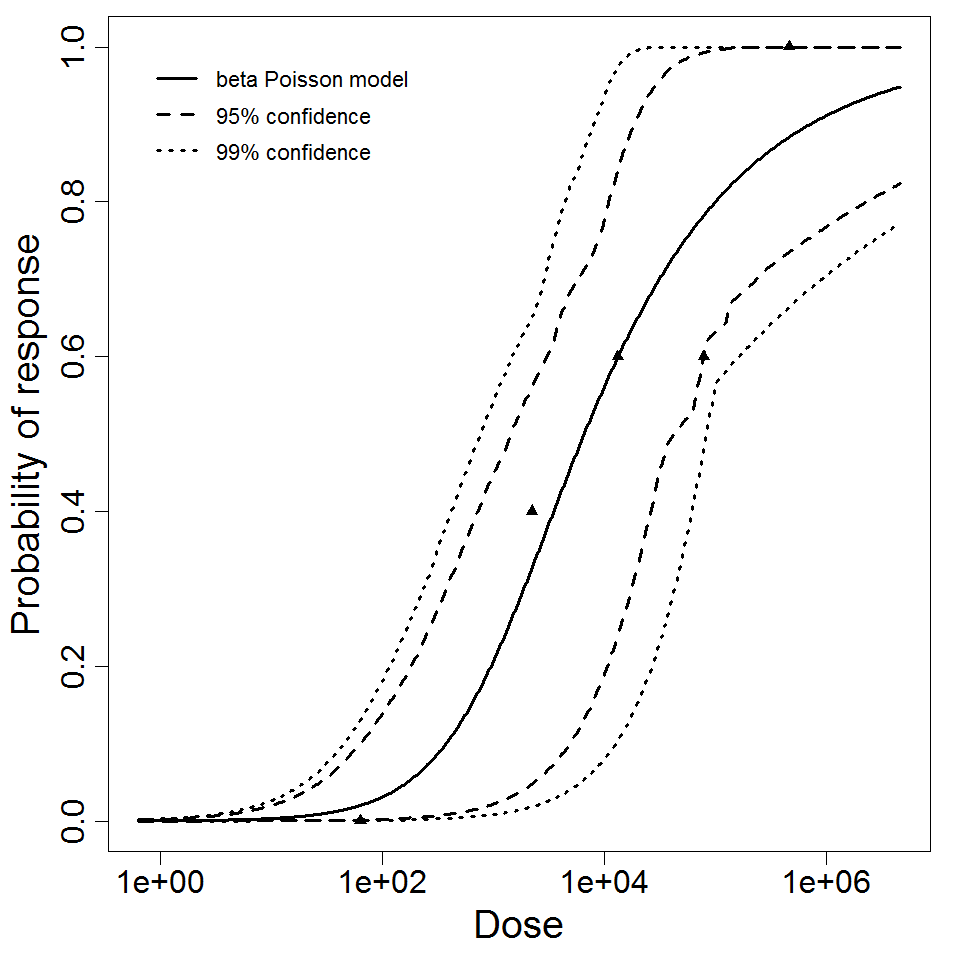
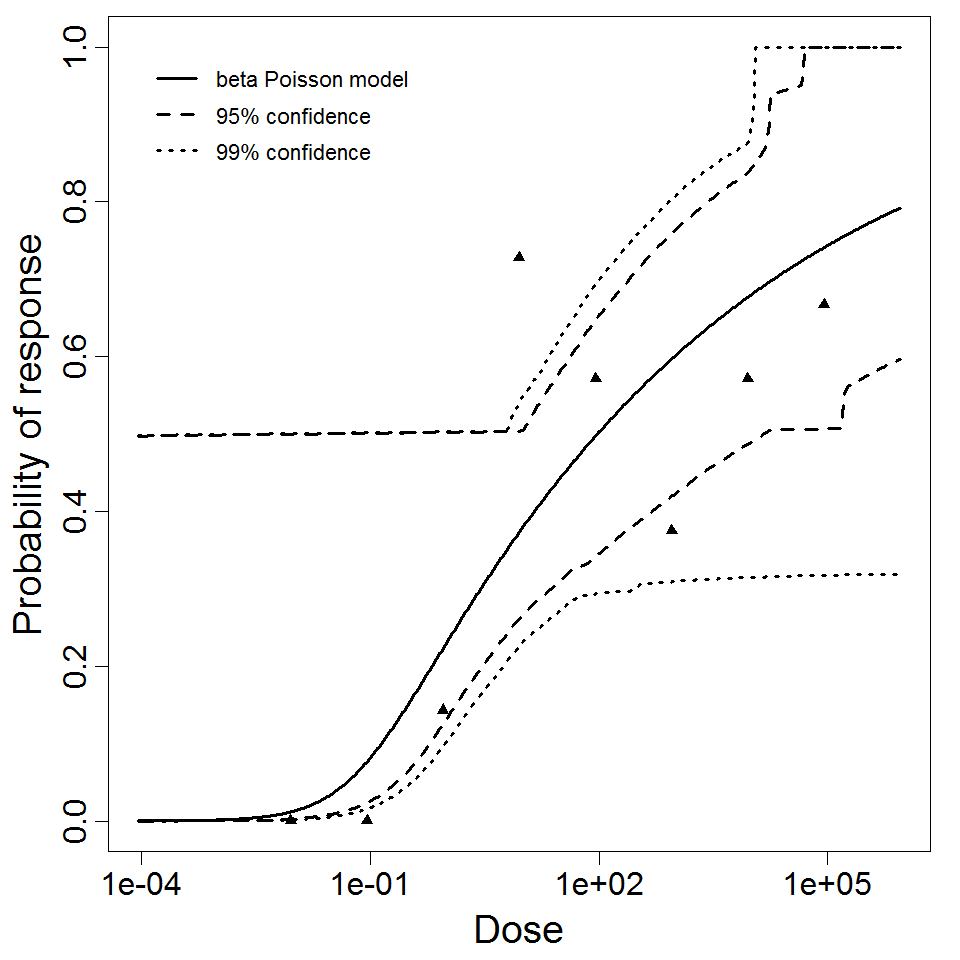
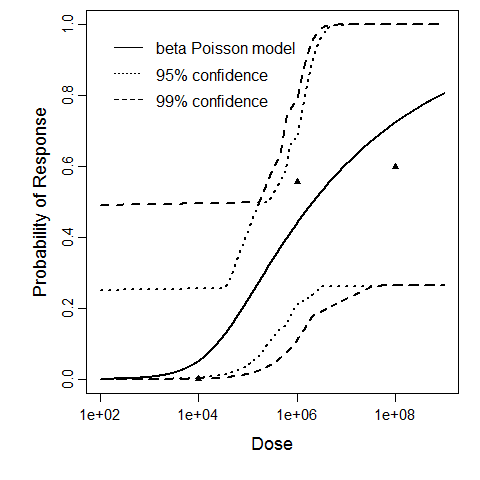
beta Poisson model plot, with confidence bounds around optimized model
|
| ||||||||||||||||||||||
| ||||||||||||||||||||||||||||||
|
| ||||||||||||||||||||||
| ||||||||||||||||||||||||||||||
|
|
||||||||||||||||||||||
|
||||||||||||||||||||||||||||||||||||||

Parameter histogram for exponential model (uncertainty of the parameter)
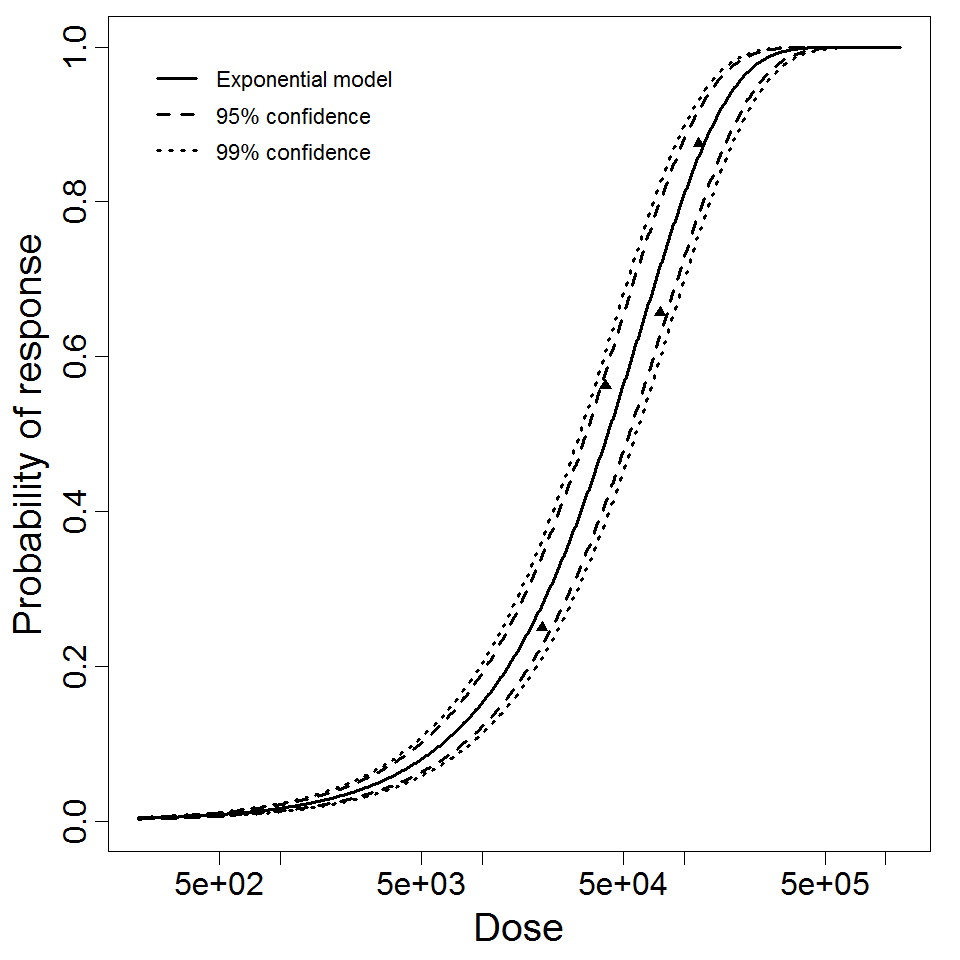
Exponential model plot, with confidence bounds around optimized model